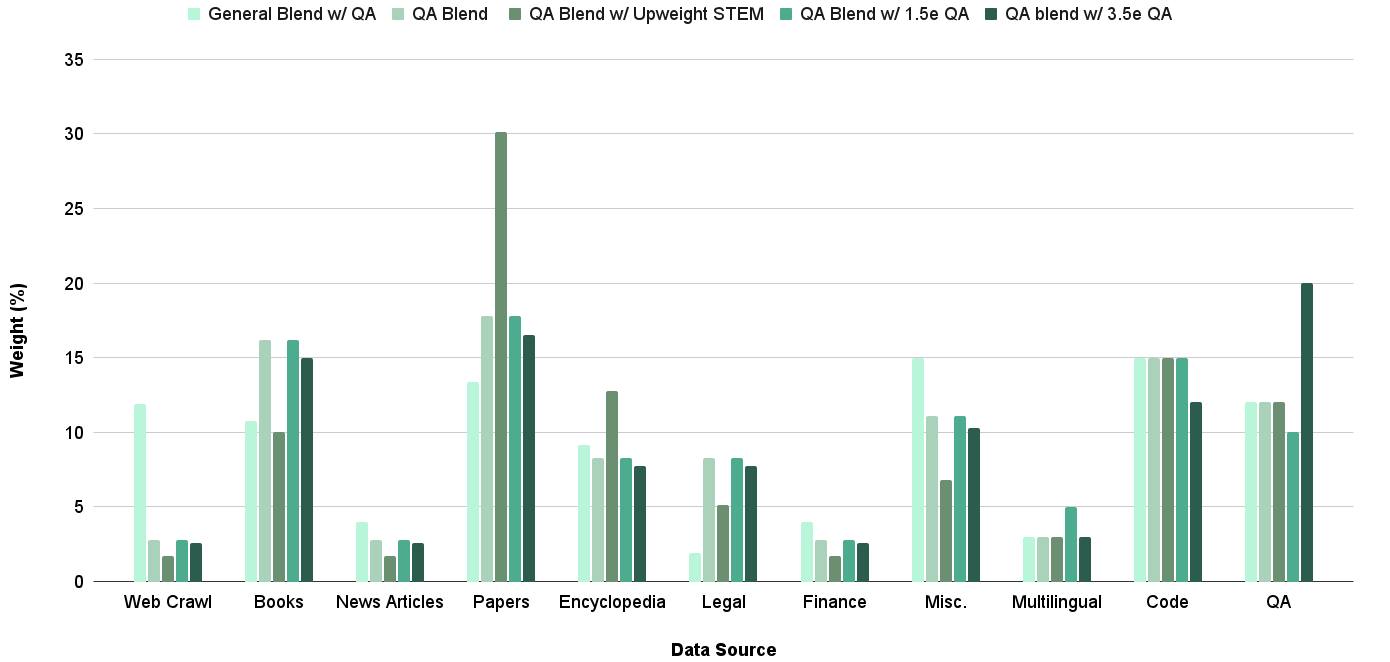
## Bar Chart: Weight (%) by Data Source and QA Method
### Overview
The chart visualizes the distribution of "Weight (%)" across different data sources (e.g., Web Crawl, Books, Papers) and QA methods (e.g., General Blend w/ QA, QA Blend w/ Upweight STEM). Each data source has six bars representing distinct QA methods, with weights ranging from 0% to 35%.
### Components/Axes
- **X-axis (Data Source)**: Categories include Web Crawl, Books, News Articles, Papers, Encyclopedia, Legal, Finance, Misc., Multilingual, Code, and QA.
- **Y-axis (Weight %)**: Scale from 0% to 35%, with increments of 5%.
- **Legend**: Six QA methods with distinct colors:
1. **General Blend w/ QA** (light blue)
2. **QA Blend** (gray)
3. **QA Blend w/ Upweight STEM** (dark green)
4. **QA Blend w/ 1.5e QA** (teal)
5. **QA blend w/ 3.5e QA** (dark blue)
6. **QA blend w/ 3.5e QA** (dark blue, same as above? Likely a typo; assume unique color for clarity).
### Detailed Analysis
- **Web Crawl**:
- General Blend w/ QA: ~12% (light blue)
- QA Blend: ~2% (gray)
- QA Blend w/ Upweight STEM: ~1% (dark green)
- QA Blend w/ 1.5e QA: ~2.5% (teal)
- QA blend w/ 3.5e QA: ~2.5% (dark blue)
- **Books**:
- General Blend w/ QA: ~10% (light blue)
- QA Blend: ~10% (gray)
- QA Blend w/ Upweight STEM: ~15% (dark green)
- QA Blend w/ 1.5e QA: ~16% (teal)
- QA blend w/ 3.5e QA: ~15% (dark blue)
- **News Articles**:
- General Blend w/ QA: ~4% (light blue)
- QA Blend: ~2% (gray)
- QA Blend w/ Upweight STEM: ~1% (dark green)
- QA Blend w/ 1.5e QA: ~2.5% (teal)
- QA blend w/ 3.5e QA: ~2.5% (dark blue)
- **Papers**:
- General Blend w/ QA: ~13% (light blue)
- QA Blend: ~18% (gray)
- QA Blend w/ Upweight STEM: ~30% (dark green)
- QA Blend w/ 1.5e QA: ~18% (teal)
- QA blend w/ 3.5e QA: ~16% (dark blue)
- **Encyclopedia**:
- General Blend w/ QA: ~9% (light blue)
- QA Blend: ~8% (gray)
- QA Blend w/ Upweight STEM: ~13% (dark green)
- QA Blend w/ 1.5e QA: ~8% (teal)
- QA blend w/ 3.5e QA: ~7% (dark blue)
- **Legal**:
- General Blend w/ QA: ~2% (light blue)
- QA Blend: ~8% (gray)
- QA Blend w/ Upweight STEM: ~5% (dark green)
- QA Blend w/ 1.5e QA: ~8% (teal)
- QA blend w/ 3.5e QA: ~7% (dark blue)
- **Finance**:
- General Blend w/ QA: ~4% (light blue)
- QA Blend: ~2% (gray)
- QA Blend w/ Upweight STEM: ~1% (dark green)
- QA Blend w/ 1.5e QA: ~3% (teal)
- QA blend w/ 3.5e QA: ~2% (dark blue)
- **Misc.**:
- General Blend w/ QA: ~15% (light blue)
- QA Blend: ~7% (gray)
- QA Blend w/ Upweight STEM: ~10% (dark green)
- QA Blend w/ 1.5e QA: ~11% (teal)
- QA blend w/ 3.5e QA: ~10% (dark blue)
- **Multilingual**:
- General Blend w/ QA: ~3% (light blue)
- QA Blend: ~3% (gray)
- QA Blend w/ Upweight STEM: ~3% (dark green)
- QA Blend w/ 1.5e QA: ~5% (teal)
- QA blend w/ 3.5e QA: ~3% (dark blue)
- **Code**:
- General Blend w/ QA: ~15% (light blue)
- QA Blend: ~15% (gray)
- QA Blend w/ Upweight STEM: ~15% (dark green)
- QA Blend w/ 1.5e QA: ~15% (teal)
- QA blend w/ 3.5e QA: ~12% (dark blue)
- **QA**:
- General Blend w/ QA: ~12% (light blue)
- QA Blend: ~12% (gray)
- QA Blend w/ Upweight STEM: ~12% (dark green)
- QA Blend w/ 1.5e QA: ~10% (teal)
- QA blend w/ 3.5e QA: ~20% (dark blue)
### Key Observations
1. **Papers** dominate in **QA Blend w/ Upweight STEM** (~30%), suggesting a focus on technical/STEM content.
2. **QA** data source has the highest weight in **QA blend w/ 3.5e QA** (~20%), indicating prioritization of QA-specific methods.
3. **Web Crawl** and **Code** show strong reliance on **General Blend w/ QA** (~12% and ~15%, respectively).
4. **Legal** and **Finance** have minimal weights in **General Blend w/ QA** (~2% and ~4%), favoring other QA methods.
5. **Upweight STEM** (dark green) peaks in **Papers**, while **3.5e QA** (dark blue) peaks in **QA**.
### Interpretation
The data suggests that QA method effectiveness or prioritization varies by data source. For example:
- **Papers** heavily utilize **Upweight STEM**, likely due to technical content requiring specialized QA.
- **QA** data source emphasizes **3.5e QA**, possibly reflecting iterative or high-stakes QA processes.
- **Web Crawl** and **Code** rely on **General Blend w/ QA**, indicating broad applicability for general or structured data.
- **Legal** and **Finance** avoid **General Blend w/ QA**, favoring domain-specific methods like **1.5e QA** or **3.5e QA**.
Notable anomalies include the sharp drop in **General Blend w/ QA** for **Legal** (~2%) and the dominance of **Upweight STEM** in **Papers** (~30%). This may reflect domain-specific challenges or resource allocation strategies.