\n
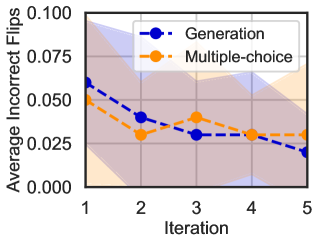
## Line Chart: Average Incorrect Flips vs. Iteration
### Overview
The image presents a line chart illustrating the relationship between the iteration number and the average number of incorrect flips for two different methods: "Generation" and "Multiple-choice". The chart includes shaded regions representing the standard deviation or confidence interval around each line.
### Components/Axes
* **X-axis:** Iteration, ranging from 1 to 5.
* **Y-axis:** Average Incorrect Flips, ranging from 0.000 to 0.100.
* **Data Series 1:** "Generation" - Represented by a blue dashed line with circular markers.
* **Data Series 2:** "Multiple-choice" - Represented by an orange dashed line with circular markers.
* **Legend:** Located in the top-right corner, identifying the two data series and their corresponding colors.
* **Shaded Regions:** Light purple around the "Generation" line and light orange around the "Multiple-choice" line, indicating variability.
* **Gridlines:** Horizontal and vertical gridlines are present to aid in reading values.
### Detailed Analysis
**Generation (Blue Line):**
The blue line representing "Generation" shows a decreasing trend.
* Iteration 1: Approximately 0.063
* Iteration 2: Approximately 0.042
* Iteration 3: Approximately 0.032
* Iteration 4: Approximately 0.030
* Iteration 5: Approximately 0.023
**Multiple-choice (Orange Line):**
The orange line representing "Multiple-choice" also shows a decreasing trend, but with more fluctuation.
* Iteration 1: Approximately 0.053
* Iteration 2: Approximately 0.035
* Iteration 3: Approximately 0.045
* Iteration 4: Approximately 0.035
* Iteration 5: Approximately 0.025
The shaded regions around each line indicate the variability in the data. The purple shaded region around the "Generation" line is wider in the first two iterations, suggesting greater variability initially. The orange shaded region around the "Multiple-choice" line shows similar variability.
### Key Observations
* Both methods demonstrate a decrease in average incorrect flips as the iteration number increases, indicating improvement in performance.
* The "Generation" method consistently exhibits a lower average incorrect flip rate than the "Multiple-choice" method across all iterations.
* The variability (as indicated by the shaded regions) appears to decrease slightly with increasing iteration number for both methods.
* The "Multiple-choice" method shows a slight increase in incorrect flips between Iteration 2 and Iteration 3.
### Interpretation
The chart suggests that both the "Generation" and "Multiple-choice" methods improve with each iteration, as evidenced by the decreasing trend in average incorrect flips. However, the "Generation" method consistently outperforms the "Multiple-choice" method, suggesting it is a more effective approach. The shaded regions indicate the uncertainty or variability in the results, which is important to consider when interpreting the data. The slight increase in incorrect flips for the "Multiple-choice" method at Iteration 3 could be due to random fluctuations or a temporary setback in the learning process. Overall, the data suggests that iterative refinement leads to improved performance in both methods, with the "Generation" method demonstrating a more consistent and superior outcome. The chart provides quantitative evidence supporting the effectiveness of iterative processes in improving the accuracy of these methods.