## Line Chart: Average Incorrect Flips Over Iterations
### Overview
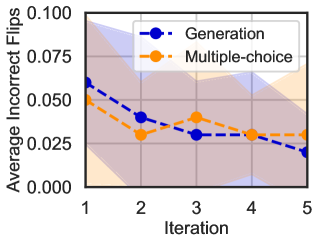
The image is a line chart comparing the performance of two methods, "Generation" and "Multiple-choice," across five iterations. The performance metric is the "Average Incorrect Flips," where a lower value indicates better performance. Each data series is represented by a dashed line with circular markers and includes a shaded region indicating the confidence interval or variability around the mean.
### Components/Axes
* **Chart Type:** Line chart with confidence intervals.
* **X-Axis (Horizontal):**
* **Label:** "Iteration"
* **Scale:** Discrete, linear scale from 1 to 5.
* **Markers:** 1, 2, 3, 4, 5.
* **Y-Axis (Vertical):**
* **Label:** "Average Incorrect Flips"
* **Scale:** Linear scale from 0.000 to 0.100.
* **Markers:** 0.000, 0.025, 0.050, 0.075, 0.100.
* **Legend:**
* **Position:** Top-right corner of the chart area.
* **Series 1:** "Generation" - Represented by a blue dashed line with blue circular markers (●).
* **Series 2:** "Multiple-choice" - Represented by an orange dashed line with orange circular markers (●).
* **Visual Elements:**
* **Shaded Regions:** A semi-transparent blue shaded area surrounds the "Generation" line, and a semi-transparent orange shaded area surrounds the "Multiple-choice" line. These represent the range of uncertainty (e.g., standard deviation or confidence interval) for each series.
### Detailed Analysis
**Data Series: Generation (Blue)**
* **Trend:** Shows a consistent downward trend across all five iterations.
* **Data Points (Approximate):**
* Iteration 1: ~0.060
* Iteration 2: ~0.040
* Iteration 3: ~0.030
* Iteration 4: ~0.030
* Iteration 5: ~0.020
* **Confidence Interval:** The blue shaded region is widest at Iteration 1 (spanning roughly 0.035 to 0.085) and narrows progressively, becoming tightest at Iteration 5.
**Data Series: Multiple-choice (Orange)**
* **Trend:** Shows an initial decrease, a slight increase at Iteration 3, and then stabilizes.
* **Data Points (Approximate):**
* Iteration 1: ~0.050
* Iteration 2: ~0.030
* Iteration 3: ~0.040
* Iteration 4: ~0.030
* Iteration 5: ~0.030
* **Confidence Interval:** The orange shaded region is also widest at the start (spanning roughly 0.000 to 0.075 at Iteration 1) and narrows over time, though it remains slightly wider than the blue region at Iteration 5.
### Key Observations
1. **Initial Performance:** At Iteration 1, the "Multiple-choice" method starts with a lower average incorrect flips value (~0.050) compared to the "Generation" method (~0.060).
2. **Convergence:** By Iteration 2, both methods have similar performance (~0.030 for Multiple-choice, ~0.040 for Generation). Their confidence intervals overlap significantly from Iteration 2 onward.
3. **Final Performance:** At Iteration 5, the "Generation" method achieves the lowest observed value (~0.020), while the "Multiple-choice" method plateaus at ~0.030.
4. **Variability:** Both methods show high initial variability (wide shaded areas), which decreases with more iterations, suggesting the results become more consistent over time.
5. **Crossover:** The "Generation" line crosses below the "Multiple-choice" line between Iteration 2 and Iteration 3 and remains below it for the rest of the charted iterations.
### Interpretation
The chart demonstrates that both the "Generation" and "Multiple-choice" methods are effective at reducing the "Average Incorrect Flips" over successive iterations. The "Generation" method shows a more consistent and ultimately greater improvement, starting from a worse position but ending with the best performance. The "Multiple-choice" method improves quickly but then hits a plateau.
The significant overlap in the confidence intervals, especially from Iteration 2 to 4, suggests that the performance difference between the two methods may not be statistically significant during those stages. The narrowing of the shaded regions indicates that the evaluation of both methods becomes more precise or stable with more iterations.
**Underlying Narrative:** This data likely comes from an iterative machine learning or optimization process (e.g., training a model, refining a prompt). The "Incorrect Flips" could refer to errors in classification, generation, or decision-making. The trend suggests that iterative refinement is beneficial, and the "Generation" approach, while potentially noisier initially, may have a higher ceiling for improvement in this specific task. The plateau of the "Multiple-choice" method could indicate it reaches its optimal performance faster but has less room for further refinement.