## Line Graph: Average Incorrect Flips Across Iterations
### Overview
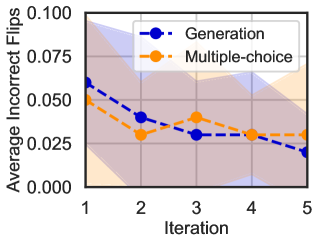
The image is a line graph comparing two data series: "Generation" (blue dashed line) and "Multiple-choice" (orange dashed line) across five iterations. The y-axis represents "Average Incorrect Flips" (ranging from 0.000 to 0.100), while the x-axis represents "Iteration" (1 to 5). Shaded regions around each line indicate variability or confidence intervals. A legend in the top-right corner identifies the two series.
### Components/Axes
- **X-axis (Iteration)**: Labeled "Iteration" with ticks at 1, 2, 3, 4, 5.
- **Y-axis (Average Incorrect Flips)**: Labeled "Average Incorrect Flips" with values from 0.000 to 0.100 in increments of 0.025.
- **Legend**: Located in the top-right corner, with:
- Blue dashed line: "Generation"
- Orange dashed line: "Multiple-choice"
- **Shaded Regions**: Gray areas around each line, representing variability or uncertainty.
### Detailed Analysis
#### Generation (Blue Dashed Line)
- **Iteration 1**: ~0.06
- **Iteration 2**: ~0.045
- **Iteration 3**: ~0.03
- **Iteration 4**: ~0.025
- **Iteration 5**: ~0.02
- **Trend**: Steady decline from ~0.06 to ~0.02, indicating consistent improvement over iterations.
#### Multiple-choice (Orange Dashed Line)
- **Iteration 1**: ~0.05
- **Iteration 2**: ~0.03
- **Iteration 3**: ~0.04
- **Iteration 4**: ~0.03
- **Iteration 5**: ~0.025
- **Trend**: Fluctuates between ~0.03 and ~0.04, with no clear directional trend.
### Key Observations
1. **Generation** shows a consistent downward trend, suggesting improved performance (fewer incorrect flips) as iterations increase.
2. **Multiple-choice** exhibits variability, with no significant improvement or decline across iterations.
3. Shaded regions for both series indicate overlapping variability, but the "Generation" series has a narrower confidence interval, implying more stable results.
### Interpretation
The data suggests that the "Generation" method outperforms "Multiple-choice" in reducing average incorrect flips over iterations. The steady decline in "Generation" implies it adapts or improves with repeated trials, while "Multiple-choice" remains inconsistent. The shaded regions highlight that "Generation" has lower uncertainty, making it a more reliable approach in this context. The lack of a clear trend in "Multiple-choice" may indicate limitations in its adaptability or sensitivity to iteration changes.