TECHNICAL ASSET FINGERPRINT
54ad6bb5ed3c6952de2c2498
Click to view fullscreen
Press ESC or click to close
FOUND IN PAPERS
EXPERT: gemma-3-27b-it-free VERSION 1
RUNTIME: google-free/gemma-3-27b-it
INTEL_VERIFIED
\n
## Charts/Graphs: Array Relaxation and Hardware-Aware MVM Simulations
### Overview
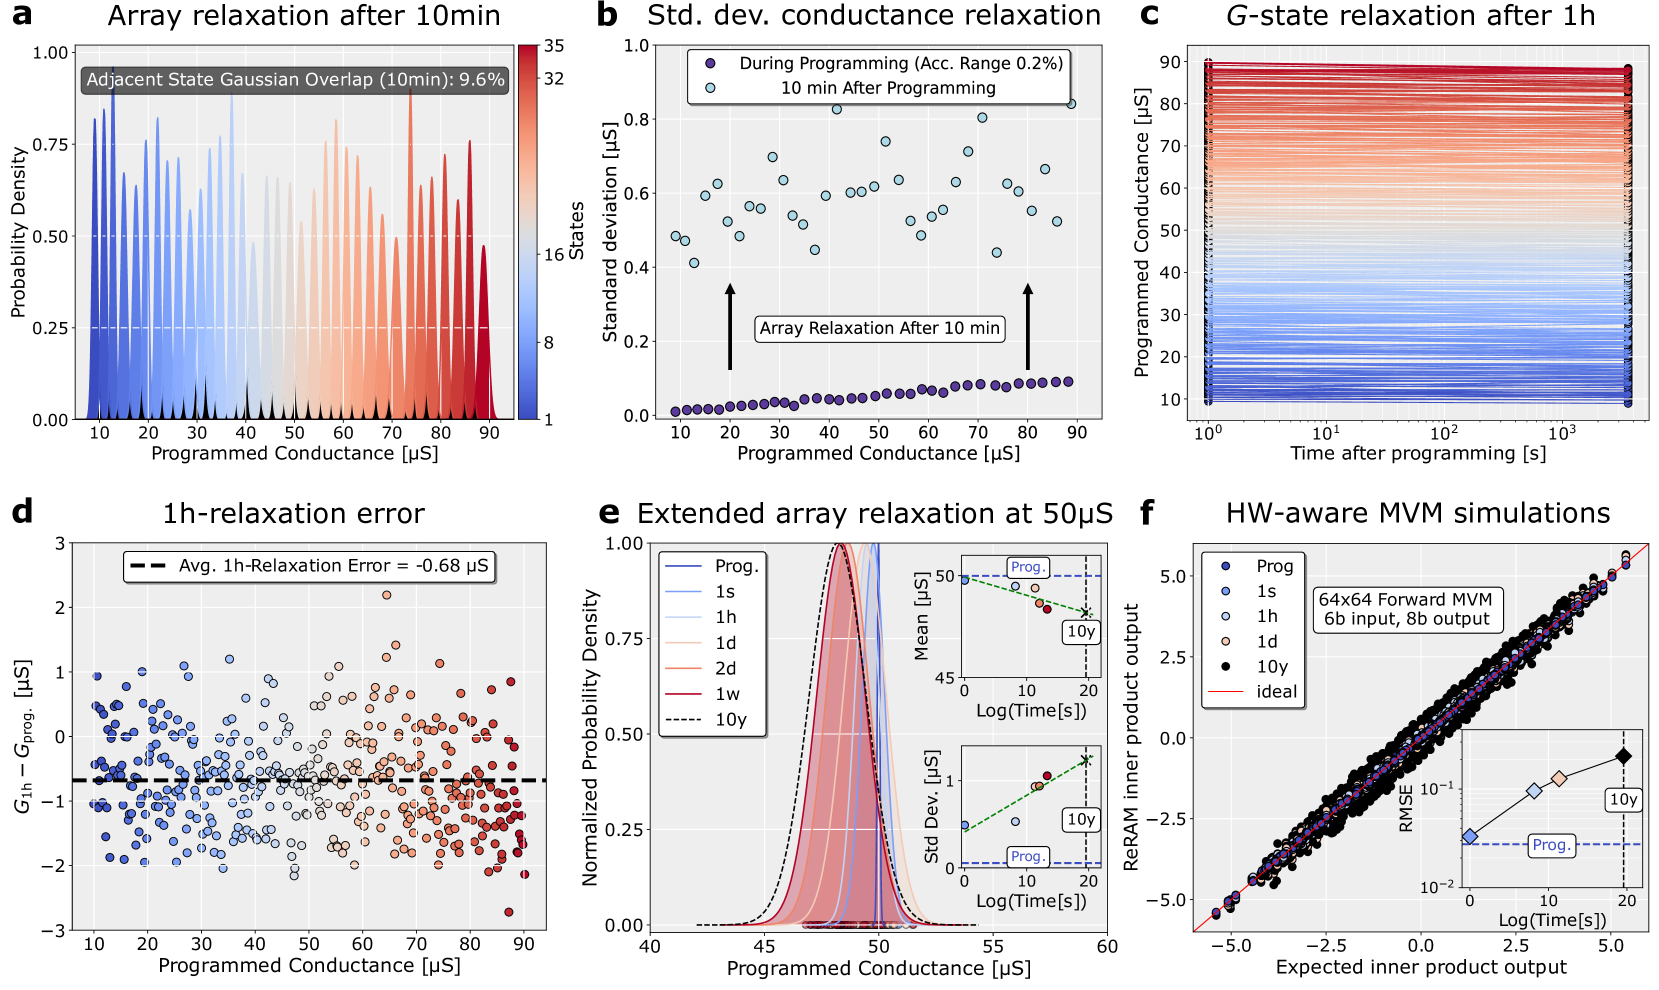
The image presents six charts (a-f) detailing the relaxation behavior of an array after programming, and simulations of hardware-aware Matrix-Vector Multiplication (MVM). The charts explore conductance relaxation over various timescales (10 minutes, 1 hour, 50 microseconds, and up to 1 week), standard deviation of conductance, and the performance of MVM simulations.
### Components/Axes
* **a) Array relaxation after 10min:**
* X-axis: Programmed Conductance \[µS] (Scale: 0 to 90, increments of 10)
* Y-axis: Probability Density (Scale: 0 to 1.0, increments of 0.25)
* Title: "Array relaxation after 10min"
* Annotation: "Adjacent Gaussian Overlay (10min): 9.6%"
* **b) Std. dev. conductance relaxation:**
* X-axis: Programmed Conductance \[µS] (Scale: 0 to 90, increments of 10)
* Y-axis: Standard deviation \[µS] (Scale: 0 to 32, increments of 8)
* Title: "Std. dev. conductance relaxation"
* Legend:
* Green circles: "During Programming (Acc. Range 0.2%)"
* Black circles: "10 min After Programming"
* Annotation: "Array Relaxation After 10 min" with an arrow pointing to the data.
* **c) G-state relaxation after 1h:**
* X-axis: Time after programming \[s] (Logarithmic scale: 10⁰ to 10³, increments are not clearly marked)
* Y-axis: Programmed Conductance \[µS] (Scale: 0 to 90, increments of 20)
* Title: "G-state relaxation after 1h"
* **d) 1h-relaxation error:**
* X-axis: Programmed Conductance \[µS] (Scale: 0 to 90, increments of 10)
* Y-axis: G<sub>fin</sub> - G<sub>prog</sub> \[µS] (Scale: -3 to 3, increments of 1)
* Title: "1h-relaxation error"
* Annotation: "Avg. 1h-Relaxation Error = -0.68 µS"
* **e) Extended array relaxation at 50µs:**
* X-axis: Programmed Conductance \[µS] (Scale: 0 to 60, increments of 10)
* Y-axis: Normalized Probability Density (Scale: 0 to 1.0, increments of 0.25)
* Title: "Extended array relaxation at 50µs"
* Legend:
* Prog.: Solid line
* 1s: Dashed line
* 1d: Dotted line
* 2d: Dashed-dotted line
* 1w: Long dashed-dotted line
* Inset Chart:
* X-axis: Log(Time[s])
* Y-axis: Mean \[µS] (Top) and Std Dev. \[µS] (Bottom)
* **f) HW-aware MVM simulations:**
* X-axis: Expected inner product output (Scale: -5 to 2.5, increments of 1)
* Y-axis: ReRAM inner product output (Scale: 0 to 5, increments of 1)
* Title: "HW-aware MVM simulations"
* Annotation: "64x64 Forward MVM, 6b input, 8b output"
* Legend:
* Prog.: Solid line
* 1s: Dashed line
* 1h: Dotted line
* 1d: Dashed-dotted line
* 10y: Long dashed-dotted line
* Inset Chart:
* X-axis: Log(Time[s])
* Y-axis: RMSE (Logarithmic scale: 10⁻¹ to 10⁰, increments of 0.2)
### Detailed Analysis or Content Details
* **a)** The probability density distribution shows a peak around 30-40 µS, with a tail extending towards higher conductance values. The adjacent Gaussian overlay suggests a 9.6% overlap.
* **b)** The standard deviation of conductance is relatively stable during programming (green circles), with values ranging from approximately 2 to 8 µS. After 10 minutes, the standard deviation increases slightly, with values ranging from approximately 4 to 12 µS.
* **c)** The programmed conductance decreases over time after programming, with a rapid initial drop followed by a slower decay. At t=1s, conductance is approximately 80 µS, decreasing to approximately 40 µS at t=100s, and leveling off around 30 µS at t=1000s.
* **d)** The 1h-relaxation error (G<sub>fin</sub> - G<sub>prog</sub>) is generally negative, indicating that the final conductance is lower than the programmed conductance. The average 1h-relaxation error is -0.68 µS. The data points are scattered around the zero line, with a slight concentration of points below the line.
* **e)** The normalized probability density distribution shifts towards lower conductance values as time increases. At Prog., the peak is around 40 µS. After 1s, the peak shifts to approximately 35 µS. After 1 week (1w), the peak shifts further to approximately 30 µS. The inset chart shows that the mean conductance decreases over time, while the standard deviation remains relatively constant.
* **f)** The ReRAM inner product output closely follows the expected inner product output, especially for shorter times (Prog., 1s, 1h). As time increases (1d, 10y), the ReRAM output deviates from the expected output. The RMSE increases with time, indicating a decrease in accuracy. The RMSE is approximately 0.01 at Prog., increasing to approximately 0.1 at 10y.
### Key Observations
* Conductance relaxation is a significant phenomenon, with conductance decreasing over time after programming.
* The standard deviation of conductance increases slightly after relaxation.
* The 1h-relaxation error is consistently negative, suggesting a systematic underestimation of the final conductance.
* MVM simulations show good accuracy for short times, but accuracy degrades over time due to conductance drift.
* The inset charts in (e) and (f) provide a more detailed view of the trends observed in the main charts.
### Interpretation
The data suggests that the ReRAM array exhibits conductance relaxation, which is a critical factor to consider for long-term reliability and accuracy. The relaxation process leads to a decrease in conductance over time, which can affect the performance of MVM operations. The simulations in (f) demonstrate that the accuracy of MVM operations degrades as the conductance drifts, highlighting the need for calibration or compensation techniques to mitigate the effects of relaxation. The adjacent Gaussian overlay in (a) suggests that the relaxation process is not uniform across the array, and that some devices may relax more quickly than others. The consistent negative relaxation error in (d) indicates a systematic bias in the relaxation process, which could be due to device-specific characteristics or programming conditions. The logarithmic scales used in (c) and (f) emphasize the importance of long-term stability and the potential for significant degradation over extended periods. Overall, the data provides valuable insights into the behavior of ReRAM arrays and the challenges associated with implementing reliable and accurate MVM operations.
DECODING INTELLIGENCE...