\n
## Diagram: Hidden Markov Model on Belief Tree
### Overview
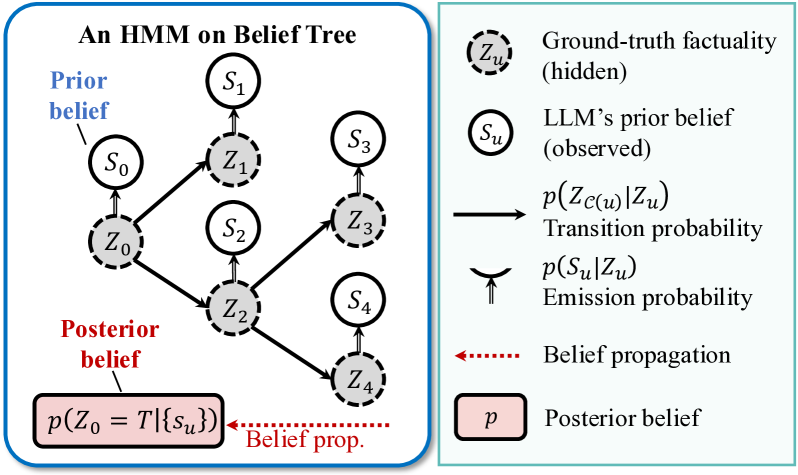
The image depicts a diagram illustrating a Hidden Markov Model (HMM) applied to a belief tree. The diagram shows a network of nodes representing states (S) and hidden variables (Z), connected by directed edges representing transitions and emissions. The diagram also includes annotations explaining the different components and processes involved.
### Components/Axes
The diagram consists of the following components:
* **Nodes:** Represent states (labeled S0-S4) and hidden variables (labeled Z0-Z4). Nodes are depicted as circles.
* **Edges:** Represent transitions and emissions between states and hidden variables. Edges are depicted as arrows.
* **Labels:** Annotations describing the different components and processes.
* **Legend:** A key explaining the meaning of different symbols and colors.
* **Title:** "An HMM on Belief Tree"
* **Annotations:**
* "Prior belief"
* "Posterior belief"
* "Belief prop." (Belief propagation)
* "p(Zc(u)|Zu)" - Transition probability
* "p(Su|Zu)" - Emission probability
* "p(Z0 = T{Su})" - Posterior belief
* **Legend:**
* Zu - Ground-truth factuality (hidden)
* Su - LLM's prior belief (observed)
* p - Posterior belief
### Detailed Analysis or Content Details
The diagram shows a belief tree structure with nodes S0, S1, S2, S3, S4 and corresponding hidden variables Z0, Z1, Z2, Z3, Z4.
* **Initial State:** S0 is the initial state, connected to S1 and S2. Z0 is the corresponding hidden variable.
* **Transitions:**
* S1 transitions to S2.
* S2 transitions to S3 and S4.
* S3 transitions to S4.
* **Emissions:** Each state (S) is associated with a hidden variable (Z) through an emission probability p(Su|Zu).
* **Prior Belief:** The "Prior belief" is indicated by an arrow pointing towards S0.
* **Posterior Belief:** The "Posterior belief" is indicated by an arrow originating from Z0.
* **Belief Propagation:** The dotted arrows represent "Belief propagation" through the tree.
* **Transition Probability:** The arrow labeled "p(Zc(u)|Zu)" indicates the transition probability between hidden states.
* **Emission Probability:** The arrow labeled "p(Su|Zu)" indicates the emission probability from hidden states to observations.
* **Posterior Belief Equation:** The equation "p(Z0 = T{Su})" represents the calculation of the posterior belief based on the observed data (Su).
### Key Observations
The diagram illustrates how an HMM can be used to model belief propagation in a tree structure. The hidden variables (Z) represent the ground-truth factuality, while the observed variables (S) represent the LLM's prior belief. The transition and emission probabilities are used to update the belief based on the observed data.
### Interpretation
The diagram demonstrates a probabilistic model for reasoning about belief and factuality. The HMM framework allows for the representation of uncertainty and the propagation of beliefs through a network of interconnected states. The use of hidden variables allows for the modeling of unobserved ground-truth factuality, while the observed variables represent the LLM's prior beliefs. The belief propagation process allows for the updating of beliefs based on new evidence. This model could be used to improve the accuracy and reliability of LLMs by incorporating a more nuanced understanding of belief and factuality. The diagram suggests a system where an LLM's prior beliefs (Su) are refined based on underlying ground truth (Zu) through a process of transition and emission probabilities, ultimately leading to a posterior belief (p). The tree structure implies a hierarchical or branching nature to the belief system, allowing for complex relationships between different beliefs.