## Diagram: Hidden Markov Model (HMM) on Belief Tree
### Overview
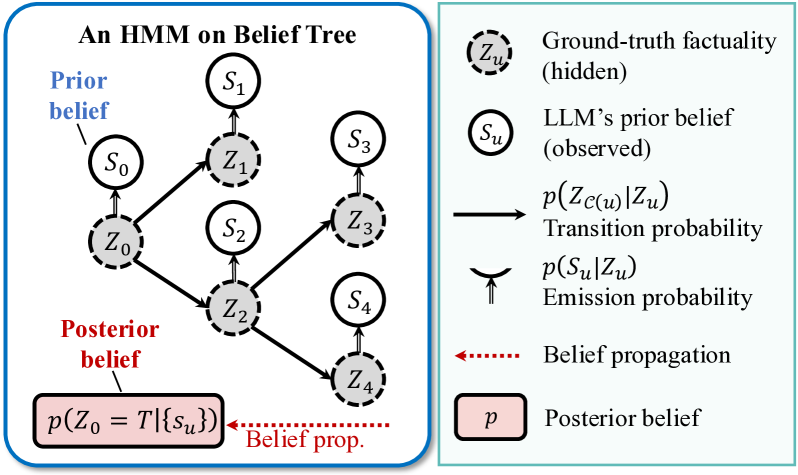
The image depicts a hierarchical Hidden Markov Model (HMM) structure applied to a belief tree, illustrating the flow of probabilistic beliefs through hidden states and observed data. The diagram is divided into two sections:
1. **Left**: A graphical representation of the HMM belief tree with nodes and transitions.
2. **Right**: A legend explaining the components, probabilities, and belief propagation.
### Components/Axes
#### Left Diagram (HMM Belief Tree)
- **Nodes**:
- **Observed States (S₀–S₄)**: Labeled as circles (e.g., S₀, S₁, S₂, S₃, S₄).
- **Hidden States (Z₀–Z₄)**: Labeled as dashed circles (e.g., Z₀, Z₁, Z₂, Z₃, Z₄).
- **Arrows**:
- **Solid arrows**: Represent transitions between observed states (e.g., S₀ → Z₀, Z₀ → S₁).
- **Dashed arrows**: Represent transitions between hidden states (e.g., Z₀ → Z₁, Z₁ → Z₂).
- **Labels**:
- "Prior belief" (blue arrow from S₀ to Z₀).
- "Posterior belief" (red arrow from Z₀ to a box labeled `P(Z₀ = T | {Sᵤ})`).
- "Belief prop." (dotted red arrow connecting posterior belief to the legend).
#### Right Diagram (Legend)
- **Components**:
- **Ground-truth factuality (hidden)**: Dashed circle labeled `Zᵤ`.
- **LLM’s prior belief (observed)**: Solid circle labeled `Sᵤ`.
- **Transition probability**: Arrow labeled `P(Z_{C(u)} | Zᵤ)`.
- **Emission probability**: Curved arrow labeled `P(Sᵤ | Zᵤ)`.
- **Belief propagation**: Dotted red arrow labeled "Belief propagation."
- **Posterior belief**: Box labeled `P`.
### Detailed Analysis
#### Left Diagram
- **Structure**:
- The tree starts at S₀ (root node), which transitions to Z₀ (hidden state).
- Z₀ branches to S₁, S₂, S₃, S₄ (observed states), each connected to their respective hidden states (Z₁–Z₄).
- Hidden states (Z₁–Z₄) are interconnected via dashed arrows, suggesting dependencies.
- **Key Elements**:
- **Prior belief**: Initial state S₀ represents the model’s initial assumption.
- **Posterior belief**: Final state `P(Z₀ = T | {Sᵤ})` aggregates updated beliefs after observing data.
#### Right Diagram
- **Probabilities**:
- **Transition probability**: `P(Z_{C(u)} | Zᵤ)` governs state transitions in the HMM.
- **Emission probability**: `P(Sᵤ | Zᵤ)` links hidden states to observed data.
- **Flow**:
- Belief propagation (dotted arrow) connects the posterior belief to the HMM structure, indicating iterative updates.
### Key Observations
1. **Hierarchical Flow**: The belief tree progresses from prior assumptions (S₀) to posterior beliefs (Z₀ = T) through hidden states (Z₀–Z₄).
2. **Probabilistic Dependencies**: Transition and emission probabilities define the relationships between hidden states and observed data.
3. **Belief Propagation**: The dotted arrow emphasizes iterative refinement of beliefs using observed data (Sᵤ) and ground-truth (Zᵤ).
### Interpretation
This diagram illustrates how an HMM updates beliefs in a dynamic system:
- **Prior belief (S₀)** serves as the initial hypothesis.
- **Hidden states (Z₀–Z₄)** encode unobserved variables influencing observed outcomes (S₁–S₄).
- **Transition/emission probabilities** quantify uncertainty in state transitions and data generation.
- **Posterior belief** (`P(Z₀ = T | {Sᵤ})`) synthesizes updated beliefs after incorporating observed data and ground-truth constraints.
The model emphasizes probabilistic reasoning under uncertainty, where beliefs are refined iteratively through belief propagation. The separation of observed (Sᵤ) and hidden (Zᵤ) states highlights the challenge of inferring ground-truth from partial data.