## Line/Bar Chart: Prior Weight Sensitivity @ 3.0 kbps (HuBERT)
### Overview
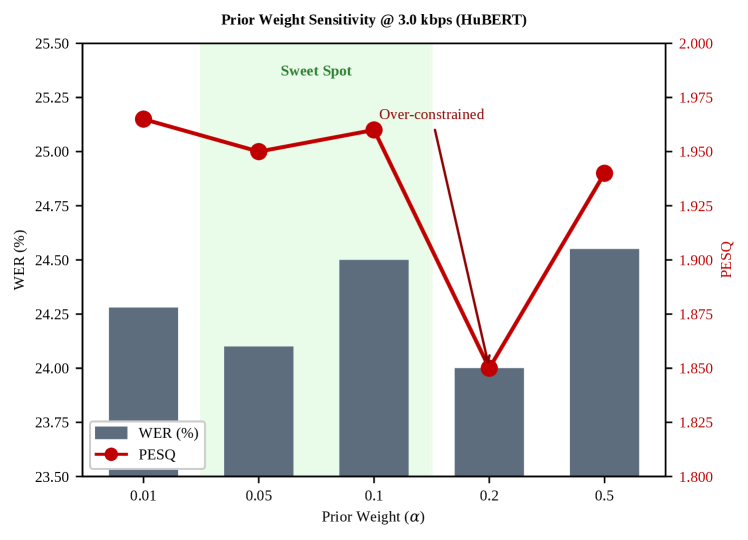
The chart visualizes the relationship between prior weight (α) and two metrics: Word Error Rate (WER, %) and Perceptual Evaluation of Speech Quality (PESQ). It combines a bar chart (WER) and line graph (PESQ) with annotations for "Sweet Spot" and "Over-constrained" regions.
### Components/Axes
- **X-axis**: Prior Weight (α) with values: 0.01, 0.05, 0.1, 0.2, 0.5
- **Left Y-axis**: WER (%) ranging from 23.50 to 25.50
- **Right Y-axis**: PESQ ranging from 1800 to 2000
- **Legend**:
- Blue bars: WER (%)
- Red line with circles: PESQ
- **Annotations**:
- Green shaded area labeled "Sweet Spot" (α=0.05–0.1)
- Red arrow labeled "Over-constrained" pointing to α=0.2
### Detailed Analysis
1. **WER (%) (Blue Bars)**:
- α=0.01: ~24.25%
- α=0.05: ~24.00%
- α=0.1: ~24.50%
- α=0.2: ~24.00%
- α=0.5: ~24.50%
- *Trend*: WER decreases slightly from α=0.01 to 0.05, then increases to α=0.1, decreases again at α=0.2, and rises at α=0.5.
2. **PESQ (Red Line)**:
- α=0.01: ~1975
- α=0.05: ~1950
- α=0.1: ~1950
- α=0.2: ~1850 (sharp drop)
- α=0.5: ~1925
- *Trend*: PESQ declines gradually until α=0.1, then plummets at α=0.2, recovering slightly at α=0.5.
3. **Annotations**:
- "Sweet Spot" (green) spans α=0.05–0.1, where WER is lowest and PESQ is stable.
- "Over-constrained" (red arrow) highlights α=0.2, where PESQ drops sharply despite WER remaining low.
### Key Observations
- **Sweet Spot**: Optimal performance occurs at α=0.05–0.1, balancing low WER and stable PESQ.
- **Over-constraint at α=0.2**: PESQ drops ~100 points despite WER remaining near 24%, suggesting a critical threshold where increased prior weight degrades speech quality.
- **U-shaped WER**: WER peaks at α=0.1 and α=0.5, indicating sensitivity to extreme prior weights.
### Interpretation
The data demonstrates a trade-off between WER and PESQ as prior weight (α) increases. While WER improves slightly with higher α (up to α=0.1), PESQ remains stable in the "Sweet Spot." However, at α=0.2, PESQ collapses sharply, suggesting over-constraint harms perceptual quality despite marginal WER improvements. This implies that maximizing WER alone is insufficient; perceptual metrics must guide prior weight selection. The U-shaped WER curve further highlights the need for careful tuning to avoid overfitting or underfitting. The "Over-constrained" annotation underscores a critical failure point where model behavior degrades unexpectedly.