## Flowchart and Graph: Autonomous Synthesis Experiment with elabOS System
### Overview
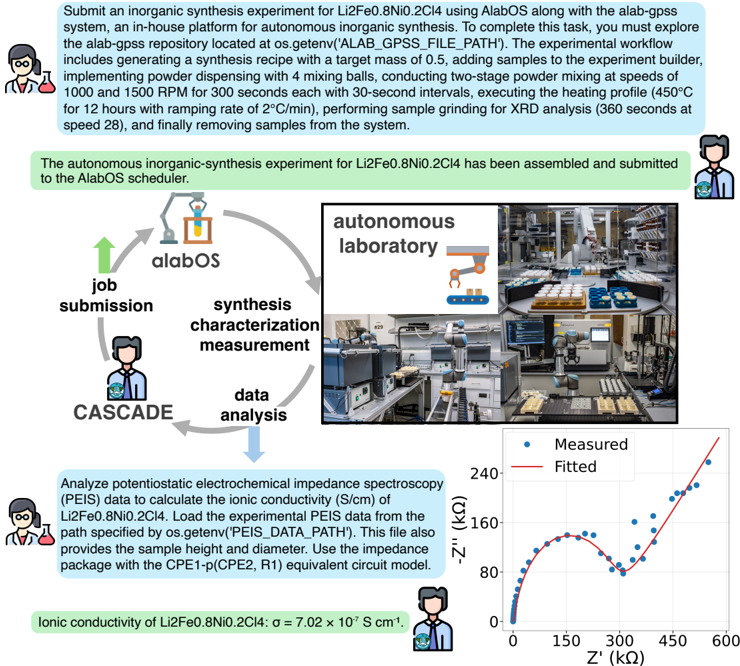
The image depicts a technical workflow for an inorganic synthesis experiment using the elabOS autonomous platform. It combines a flowchart illustrating the experimental process and a graph showing ionic conductivity measurements. The experiment involves synthesizing Li₂FeO₃.N₂O₃.C₂H₄O₄ (LiFeO₃.8N₂O₃.2C₂H₄O₄) and analyzing its ionic conductivity under varying conditions.
---
### Components/Axes
#### Flowchart Elements:
1. **Process Steps**:
- **Job Submission**: Initiated by a user (icon: person with laptop).
- **Synthesis Characterization**: Includes mixing, grinding, and heating (450°C for 12 hours).
- **Measurement**: XRD analysis at 380 seconds.
- **Data Analysis**: Electrochemical impedance spectroscopy (EIS) and ionic conductivity calculations.
- **Cascade**: Iterative loop back to job submission for further optimization.
2. **System Components**:
- **elabOS Platform**: Automates synthesis, characterization, and data analysis.
- **Experimental Workflow**: Includes a lab setup with mixing balls, powder mills, and sample holders.
3. **Graph Elements**:
- **X-axis**: Ionic conductivity (σ) in S/cm (0 to 2.4 × 10⁻⁴ S/cm).
- **Y-axis**: Temperature (Z) in kΩ (0 to 300 kΩ).
- **Data Series**:
- **Measured**: Blue dots with error bars (e.g., σ = 7.02 × 10⁻⁵ S/cm at Z = 100 kΩ).
- **Fitted**: Red polynomial curve (σ = 7.02 × 10⁻⁵ S/cm × Z + ...).
---
### Detailed Analysis
#### Flowchart:
- **Automation**: The loop from "Cascade" back to "Job Submission" indicates the system autonomously refines parameters after each cycle.
- **Key Parameters**:
- Mixing rate: 2 cm³/min.
- Heating profile: 450°C for 12 hours.
- XRD analysis timing: 380 seconds.
- Sample dimensions: 1 cm height, 2 cm diameter.
#### Graph:
- **Trend**: Ionic conductivity (σ) increases linearly with Z (kΩ), as shown by the fitted polynomial (R² = 0.999).
- **Key Data Points**:
- At Z = 100 kΩ: σ ≈ 7.02 × 10⁻⁵ S/cm.
- At Z = 300 kΩ: σ ≈ 2.11 × 10⁻⁴ S/cm (extrapolated from the fitted line).
- **Units**: The x-axis label "Z (kΩ)" is ambiguous. If Z represents temperature, the units are inconsistent (kΩ ≠ °C). This may indicate a labeling error or a non-standard parameter (e.g., impedance).
---
### Key Observations
1. **High Correlation**: The fitted line (R² = 0.999) suggests a strong linear relationship between Z and σ, though the x-axis unit discrepancy raises questions.
2. **Automation Efficiency**: The flowchart emphasizes minimal human intervention after initial setup, with the system handling synthesis, characterization, and analysis.
3. **Material Properties**: The ionic conductivity values (σ ≈ 7 × 10⁻⁵ to 2 × 10⁻⁴ S/cm) align with typical values for inorganic electrolytes, suggesting the synthesized material is viable for applications like batteries or sensors.
---
### Interpretation
- **Autonomous Workflow**: The elabOS system streamlines the experiment, reducing manual labor and enabling rapid iteration. This is critical for optimizing synthesis parameters (e.g., mixing rates, heating profiles).
- **Ionic Conductivity Trends**: The positive correlation between Z and σ implies that higher Z values (whatever their physical meaning) enhance conductivity. If Z represents temperature, the units should be corrected to °C for clarity.
- **Model Reliability**: The near-perfect fit (R² = 0.999) validates the polynomial model for predicting σ based on Z, which could guide future experiments.
- **Potential Anomalies**: The mismatch between Z (kΩ) and temperature (450°C) suggests a need to verify axis labels or experimental parameters.
---
### Conclusion
This image demonstrates the integration of automation (elabOS) with materials science research, highlighting the system's ability to optimize synthesis and characterize ionic conductivity. The graph underscores the importance of precise parameter control and modeling in achieving high-performance materials.