## Line Chart: LongBench Accuracy vs KV Cache Size (Dataset: Trec)
### Overview
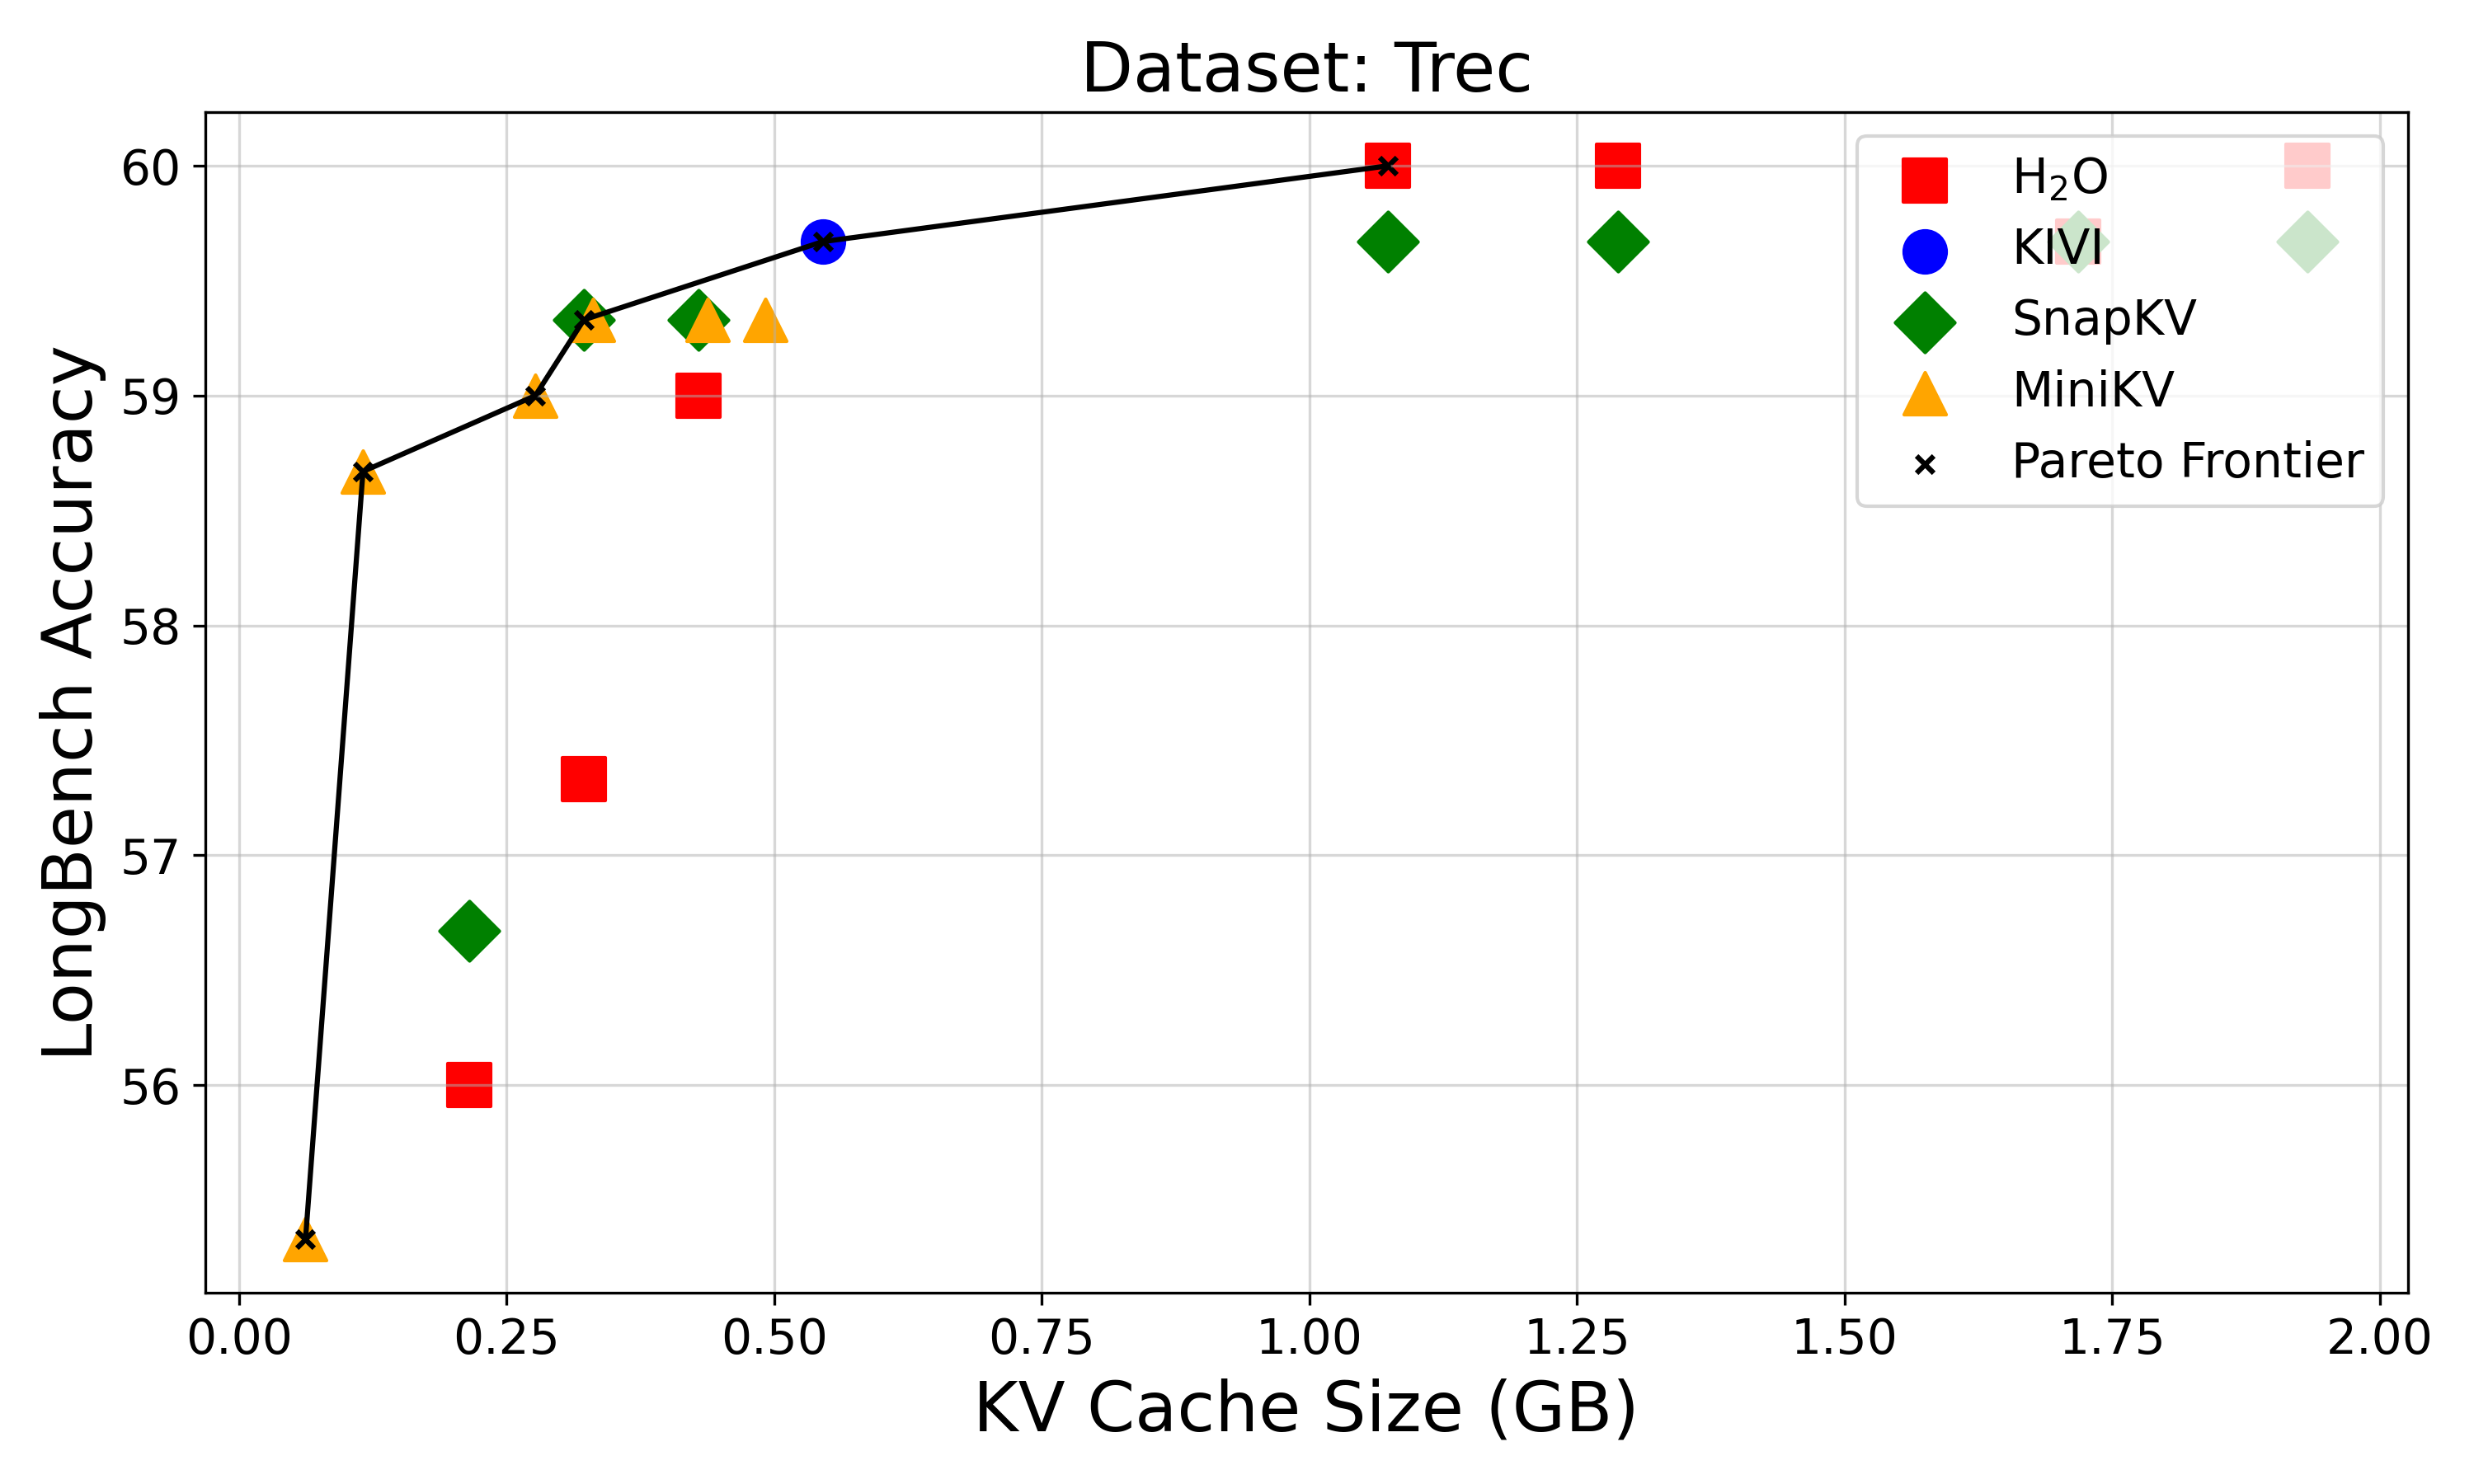
The chart illustrates the relationship between KV cache size (in GB) and LongBench accuracy for various key-value (KV) storage systems. A Pareto Frontier line is plotted to represent the optimal trade-off between cache size and accuracy. Data points for five systems (H2O, KIVI, SnapKV, MiniKV) are marked with distinct symbols and colors, while the Pareto Frontier is represented by a black line with crosses.
### Components/Axes
- **X-axis**: KV Cache Size (GB), ranging from 0.00 to 2.00 GB in 0.25 GB increments.
- **Y-axis**: LongBench Accuracy, ranging from 56 to 60 in 1-point increments.
- **Legend**: Located in the top-right corner, mapping symbols/colors to systems:
- Red squares: H2O
- Blue circle: KIVI
- Green diamonds: SnapKV
- Yellow triangles: MiniKV
- Black crosses: Pareto Frontier
### Detailed Analysis
1. **Pareto Frontier**:
- A smooth black line with crosses, starting at (0.00 GB, 55.5) and rising to (2.00 GB, 60.0).
- The line shows a consistent upward slope, indicating that larger cache sizes generally improve accuracy.
2. **Data Points**:
- **H2O (Red Squares)**:
- Points at (0.25 GB, 56.0), (0.50 GB, 57.5), (1.00 GB, 59.5), and (1.25 GB, 60.0).
- Two points lie on the Pareto Frontier (1.00 GB and 1.25 GB).
- **KIVI (Blue Circle)**:
- Single point at (0.50 GB, 59.5), lying on the Pareto Frontier.
- **SnapKV (Green Diamonds)**:
- Points at (0.25 GB, 56.5), (0.50 GB, 59.0), and (1.25 GB, 59.5).
- Two points (0.50 GB and 1.25 GB) are on the Pareto Frontier.
- **MiniKV (Yellow Triangles)**:
- Points at (0.10 GB, 55.5), (0.25 GB, 59.0), and (0.50 GB, 59.5).
- Two points (0.25 GB and 0.50 GB) are on the Pareto Frontier.
### Key Observations
- **Optimal Efficiency**: Systems like KIVI and H2O achieve Pareto-optimal accuracy at specific cache sizes (e.g., 0.50 GB for KIVI, 1.00–1.25 GB for H2O).
- **Suboptimal Performance**: SnapKV and MiniKV have points below the Pareto Frontier, suggesting inefficiencies in their cache utilization.
- **Accuracy Trends**: All systems show improved accuracy with larger cache sizes, but the rate of improvement varies. For example, H2O gains 4.0 accuracy points from 0.25 GB to 1.25 GB, while MiniKV gains 4.0 points from 0.10 GB to 0.50 GB.
### Interpretation
The chart demonstrates that increasing KV cache size generally enhances LongBench accuracy, but the efficiency of this trade-off differs across systems. The Pareto Frontier highlights the most efficient configurations:
- **KIVI** achieves the highest accuracy (59.5) at the smallest cache size (0.50 GB), making it highly efficient.
- **H2O** and **SnapKV** require larger caches (1.00–1.25 GB) to reach near-optimal accuracy (59.5–60.0), indicating higher resource demands.
- **MiniKV** shows rapid improvement at low cache sizes but plateaus at 0.50 GB, suggesting diminishing returns beyond this point.
This analysis implies that system designers should prioritize cache size allocation based on the specific accuracy-versus-resource trade-offs of their chosen KV system. The Pareto Frontier serves as a critical benchmark for evaluating performance efficiency.