\n
## Diagram: LLM-based QA Systems - Conceptual Evolution
### Overview
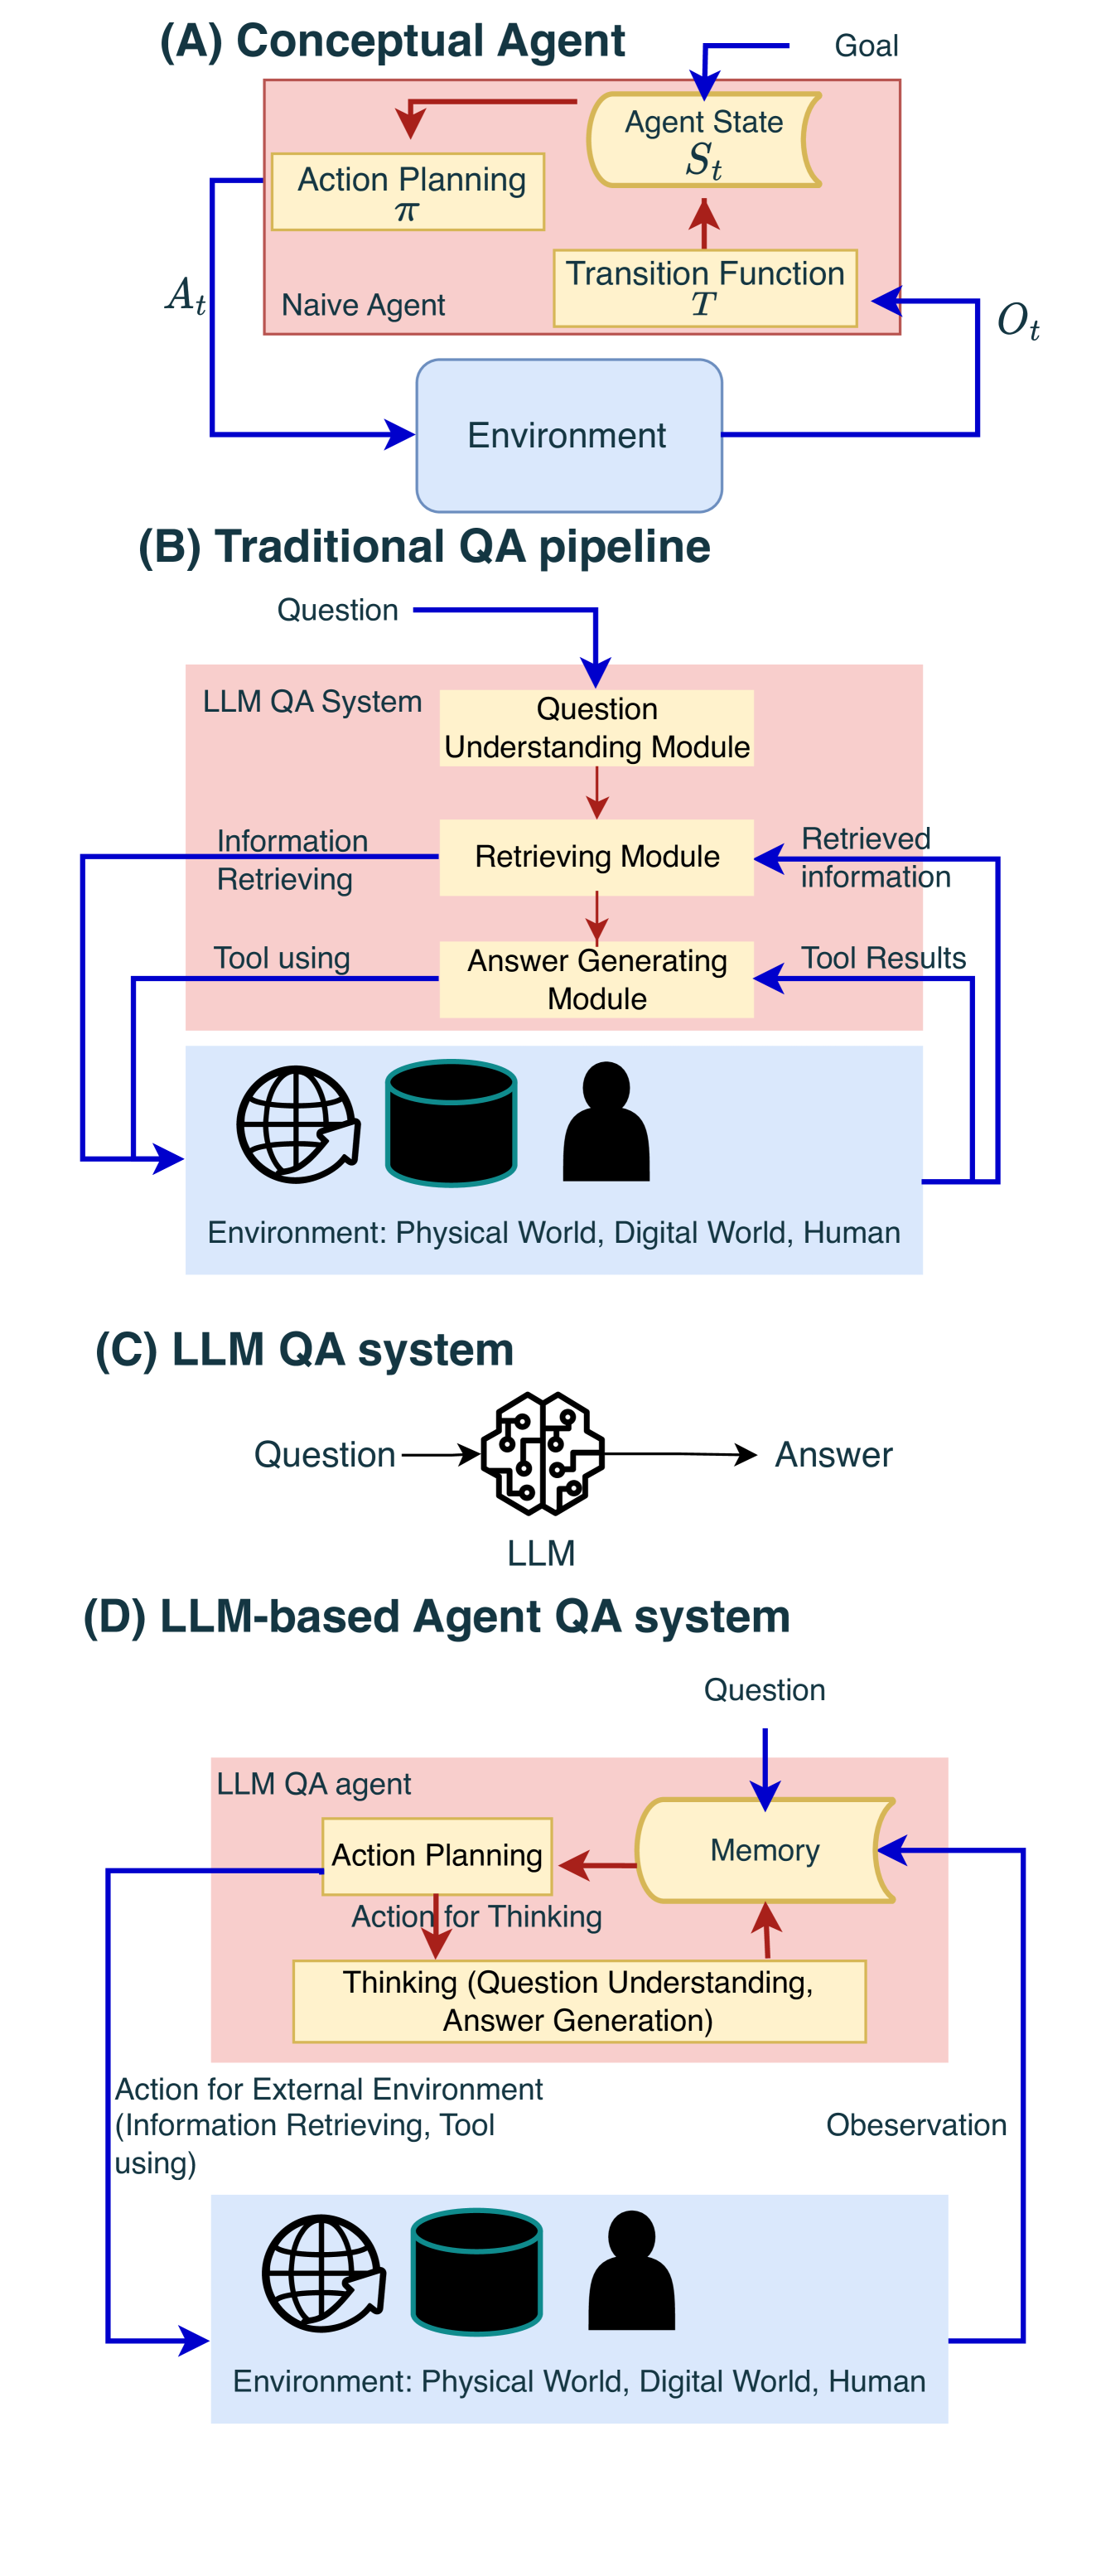
The image presents a comparative diagram illustrating the evolution of Question Answering (QA) systems, from conceptual agents to LLM-based agents. It's divided into four sections (A, B, C, and D), each representing a different approach. The diagram uses flowcharts to depict the process and interactions within each system.
### Components/Axes
The diagram doesn't have traditional axes. Instead, it uses labeled boxes and arrows to represent components and their relationships. Key components include:
* **Agent State (S<sub>t</sub>):** Represented in (A).
* **Goal:** Represented in (A).
* **Naive Agent (A<sub>t</sub>):** Represented in (A).
* **Action Planning (π):** Represented in (A) and (D).
* **Transition Function (T):** Represented in (A).
* **Environment:** Present in all sections (A, B, C, and D).
* **Question:** Input to QA systems (B, C, and D).
* **Answer:** Output from QA systems (C and D).
* **LLM QA System:** Overall system in (B).
* **Question Understanding Module:** Component of (B).
* **Retrieving Module:** Component of (B).
* **Answer Generating Module:** Component of (B).
* **Information Retrieving:** Input to (B).
* **Tool Using:** Input to (B).
* **Retrieved Information:** Output of (B).
* **Tool Results:** Output of (B).
* **LLM:** Core component of (C).
* **LLM QA Agent:** Core component of (D).