# Technical Document Extraction: Line Chart Analysis
## Chart Overview
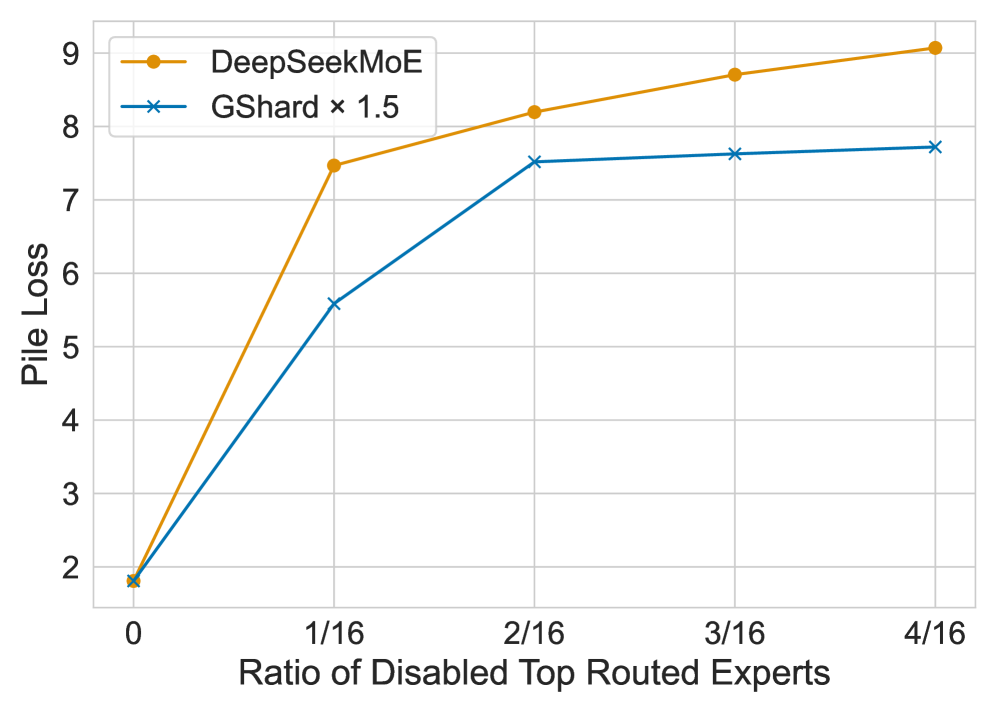
The image depicts a line chart comparing two models, **DeepSeekMoE** and **GShard x1.5**, across varying ratios of disabled top routed experts. The y-axis represents **Pile Loss**, while the x-axis represents the **Ratio of Disabled Top Routed Experts**.
---
## Axis Labels and Markers
- **X-Axis (Horizontal):**
- Title: *"Ratio of Disabled Top Routed Experts"*
- Markers:
- `0`
- `1/16`
- `2/16`
- `3/16`
- `4/16`
- **Y-Axis (Vertical):**
- Title: *"Pile Loss"*
- Range: `2` to `9` (in increments of 1)
---
## Legend
- **DeepSeekMoE**
- Color: Orange (`#FFD700`)
- Line Style: Solid
- Data Points:
- `0`: 2
- `1/16`: 7.5
- `2/16`: 8.2
- `3/16`: 8.7
- `4/16`: 9.0
- **GShard x1.5**
- Color: Blue (`#0000FF`)
- Line Style: Dashed with X markers
- Data Points:
- `0`: 2
- `1/16`: 5.5
- `2/16`: 7.5
- `3/16`: 7.7
- `4/16`: 7.8
---
## Key Trends
1. **DeepSeekMoE**
- Starts at `2` (baseline) and increases sharply at `1/16` (ratio).
- Maintains a steady upward trend, reaching `9.0` at `4/16`.
- Slope: Linear growth with a consistent rate of increase.
2. **GShard x1.5**
- Also starts at `2` but rises more gradually.
- Accelerates between `1/16` and `2/16`, then plateaus slightly.
- Ends at `7.8` at `4/16`, remaining below DeepSeekMoE throughout.
---
## Data Point Cross-Reference
| Ratio of Disabled Experts | DeepSeekMoE Pile Loss | GShard x1.5 Pile Loss |
|---------------------------|-----------------------|-----------------------|
| `0` | 2 | 2 |
| `1/16` | 7.5 | 5.5 |
| `2/16` | 8.2 | 7.5 |
| `3/16` | 8.7 | 7.7 |
| `4/16` | 9.0 | 7.8 |
---
## Observations
- **DeepSeekMoE** consistently outperforms **GShard x1.5** in minimizing pile loss as the ratio of disabled experts increases.
- **GShard x1.5** shows diminishing returns after `2/16`, suggesting limited scalability under higher expert disablement.
- Both models share the same baseline performance (`2`) when no experts are disabled.
---
## Notes
- The chart uses distinct line styles and markers to differentiate models.
- No additional annotations or contextual text are present in the image.
- Data points are explicitly marked with symbols (circle for DeepSeekMoE, X for GShard x1.5).