# Technical Document Extraction: Success Rate vs. History Trajectory Length
## 1. Image Classification and Overview
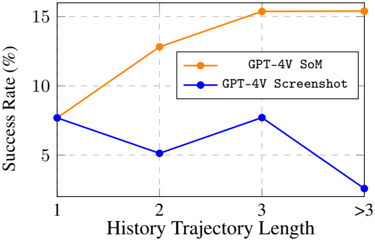
This image is a line graph comparing the performance of two AI model configurations (GPT-4V SoM and GPT-4V Screenshot) based on their success rate relative to the length of history trajectory.
## 2. Component Isolation
### A. Header/Axes
* **Y-Axis Label:** Success Rate (%)
* **Y-Axis Markers:** 5, 10, 15 (with intermediate grid lines at 2.5 intervals)
* **X-Axis Label:** History Trajectory Length
* **X-Axis Markers:** 1, 2, 3, >3
### B. Legend
* **Location:** Mid-right quadrant of the chart area.
* **Series 1:** Orange line with circular markers — **GPT-4V SoM**
* **Series 2:** Blue line with circular markers — **GPT-4V Screenshot**
### C. Main Chart Area
* **Grid:** Dashed light-gray vertical and horizontal grid lines.
* **Data Points:** 4 points per series.
---
## 3. Data Extraction and Trend Analysis
### Series 1: GPT-4V SoM (Orange Line)
* **Trend Verification:** The line shows a strong upward slope from length 1 to 3, followed by a plateau. This indicates that increasing the history trajectory length significantly improves performance for this model up to a point.
* **Data Points:**
* **Length 1:** ~7.8%
* **Length 2:** ~13.0%
* **Length 3:** ~15.5%
* **Length >3:** ~15.5%
### Series 2: GPT-4V Screenshot (Blue Line)
* **Trend Verification:** The line shows an inconsistent, fluctuating trend. It starts at the same point as the SoM model, drops at length 2, recovers at length 3, and then drops significantly at lengths greater than 3.
* **Data Points:**
* **Length 1:** ~7.8%
* **Length 2:** ~5.2%
* **Length 3:** ~7.8%
* **Length >3:** ~2.5%
---
## 4. Reconstructed Data Table
| History Trajectory Length | GPT-4V SoM Success Rate (%) | GPT-4V Screenshot Success Rate (%) |
| :--- | :--- | :--- |
| 1 | 7.8 | 7.8 |
| 2 | 13.0 | 5.2 |
| 3 | 15.5 | 7.8 |
| >3 | 15.5 | 2.5 |
*(Note: Numerical values are estimated based on the Y-axis scale and grid alignment.)*
---
## 5. Technical Summary
The chart demonstrates a clear performance advantage for the **GPT-4V SoM** configuration as the history trajectory length increases. While both models start with an identical success rate at a trajectory length of 1, the SoM model scales effectively, doubling its success rate by length 3. Conversely, the **GPT-4V Screenshot** model fails to benefit from longer trajectories, showing a net decline in performance when the trajectory length exceeds 3.