## Line Graph: Success Rate vs. History Trajectory Length
### Overview
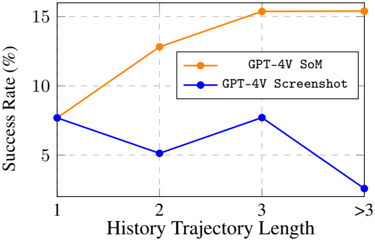
The image is a line graph comparing the success rates of two methods, "GPT-4V SoM" (orange line) and "GPT-4V Screenshot" (blue line), across varying lengths of history trajectory. The y-axis represents success rate (%) from 0 to 15, and the x-axis categorizes history trajectory lengths as 1, 2, 3, and ">3". The legend is positioned in the top-right corner, with orange and blue markers corresponding to the two methods.
### Components/Axes
- **Title**: "Success Rate (%)"
- **X-axis**: "History Trajectory Length" with categories: 1, 2, 3, >3
- **Y-axis**: "Success Rate (%)" with ticks at 0, 5, 10, 15
- **Legend**:
- Orange line: "GPT-4V SoM"
- Blue line: "GPT-4V Screenshot"
- **Data Points**:
- Orange line (SoM): 7% (1), 12% (2), 15% (3), 15% (>3)
- Blue line (Screenshot): 7% (1), 5% (2), 7% (3), 2% (>3)
### Detailed Analysis
- **GPT-4V SoM (Orange Line)**:
- Starts at 7% for trajectory length 1.
- Increases to 12% at length 2.
- Rises to 15% at length 3 and remains constant at 15% for lengths >3.
- Trend: Steady upward trajectory with plateau at higher lengths.
- **GPT-4V Screenshot (Blue Line)**:
- Starts at 7% for trajectory length 1.
- Drops to 5% at length 2.
- Recovers to 7% at length 3.
- Plummets to 2% for lengths >3.
- Trend: Volatile with a sharp decline at the longest trajectory.
### Key Observations
1. **GPT-4V SoM** maintains a consistently high success rate (15%) for trajectories of length 3 and longer, indicating robustness.
2. **GPT-4V Screenshot** shows a significant drop in success rate (from 7% to 2%) for trajectories >3, suggesting poor performance with extended data.
3. Both methods start with identical success rates (7%) at trajectory length 1, but diverge sharply afterward.
### Interpretation
The data suggests that **GPT-4V SoM** is more effective at handling longer history trajectories, maintaining high success rates even as complexity increases. In contrast, **GPT-4V Screenshot** struggles with longer trajectories, experiencing a dramatic decline in performance. This could imply that the SoM method is better suited for tasks requiring extended contextual analysis, while the Screenshot method may be limited by its inability to process or retain information from longer sequences. The sharp drop in the Screenshot method at ">3" trajectory length highlights a critical limitation, potentially due to memory constraints or algorithmic inefficiencies in handling extended data.