## Line Chart Grid: AIME-24 Accuracy vs (binned) Length of Thoughts
### Overview
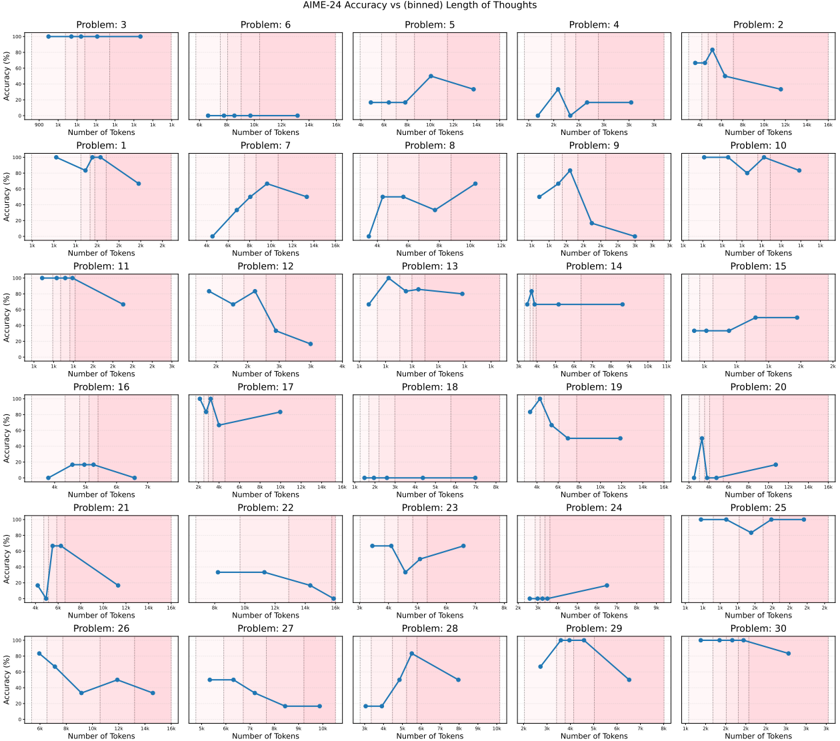
The image displays a 6x5 grid of line charts comparing AIME-24 accuracy percentages against the number of tokens used in reasoning for 30 distinct problems. Each subplot represents a unique problem (labeled Problem 1–30), with accuracy trends visualized as blue lines against a pink background. The charts show variability in how accuracy correlates with token length across different problems.
### Components/Axes
- **X-axis**: "Number of Tokens" (ranges from 0 to 160 tokens, with markers at intervals like 20, 40, 60, etc.).
- **Y-axis**: "Accuracy (%)" (ranges from 0% to 100% in 20% increments).
- **Legend**: Located on the right side of the grid, labeled "AIME-24 Accuracy" with a solid blue line. All subplot lines match this legend entry.
- **Subplot Labels**: Each chart is titled "Problem X" (X = 1–30), positioned above its respective plot.
### Detailed Analysis
- **Problem 3**: Flat line at 100% accuracy across all token counts (0–160).
- **Problem 6**: Accuracy starts at 0% and linearly increases to 100% at 160 tokens.
- **Problem 5**: Peaks at ~80% accuracy at 120 tokens, then drops to ~40% at 160 tokens.
- **Problem 2**: Peaks at ~90% accuracy at 40 tokens, then declines to ~30% at 160 tokens.
- **Problem 10**: Maintains 100% accuracy until 140 tokens, then drops to ~60% at 160 tokens.
- **Problem 15**: Peaks at ~95% accuracy at 20 tokens, then declines to ~40% at 160 tokens.
- **Problem 20**: Peaks at ~90% accuracy at 20 tokens, then drops to ~20% at 160 tokens.
- **Problem 25**: Flat at 100% accuracy until 140 tokens, then drops to ~60% at 160 tokens.
- **Problem 27**: Peaks at ~85% accuracy at 100 tokens, then declines to ~30% at 160 tokens.
- **Problem 29**: Peaks at ~90% accuracy at 100 tokens, then drops to ~20% at 160 tokens.
- **Problem 30**: Flat at 100% accuracy until 140 tokens, then drops to ~50% at 160 tokens.
- **Other Problems**: Show mixed trends, including gradual declines (e.g., Problem 1), plateaus (e.g., Problem 7), or erratic fluctuations (e.g., Problem 11).
### Key Observations
1. **Stable Performance**: Problems 3, 10, 25, and 30 maintain high accuracy regardless of token length until a sharp drop at the maximum token count.
2. **Optimal Token Thresholds**: Problems like 5, 2, 15, 20, 27, and 29 exhibit a clear peak in accuracy at specific token counts (e.g., 20–120 tokens), followed by a decline.
3. **Linear Trends**: Problem 6 shows a linear increase in accuracy with token length, suggesting longer reasoning improves performance.
4. **Fluctuations**: Problems 1, 7, 8, 9, 11, 12, 13, 14, 16, 17, 18, 19, 21, 22, 23, 24, 26, and 28 display non-monotonic trends, indicating complex relationships between token length and accuracy.
### Interpretation
The data suggests that AIME-24's performance is highly problem-dependent:
- **Stable Problems**: For tasks like Problem 3, accuracy remains constant, implying the model's reasoning is robust to token length variations.
- **Optimal Length**: Problems with peaks (e.g., Problem 5) indicate an optimal token range where additional tokens degrade performance, possibly due to overthinking or noise introduction.
- **Linear Scaling**: Problem 6's linear trend suggests longer reasoning consistently improves accuracy, highlighting tasks where depth of thought is critical.
- **Dropoff at Max Tokens**: Many problems (e.g., 10, 15, 20, 25, 30) show sharp accuracy declines at the maximum token count (160), potentially reflecting computational limits or model saturation.
This variability underscores the importance of problem-specific reasoning strategies, where token length must be carefully calibrated to balance depth and efficiency.