## Histogram: Weight Value Distribution Across Rounds
### Overview
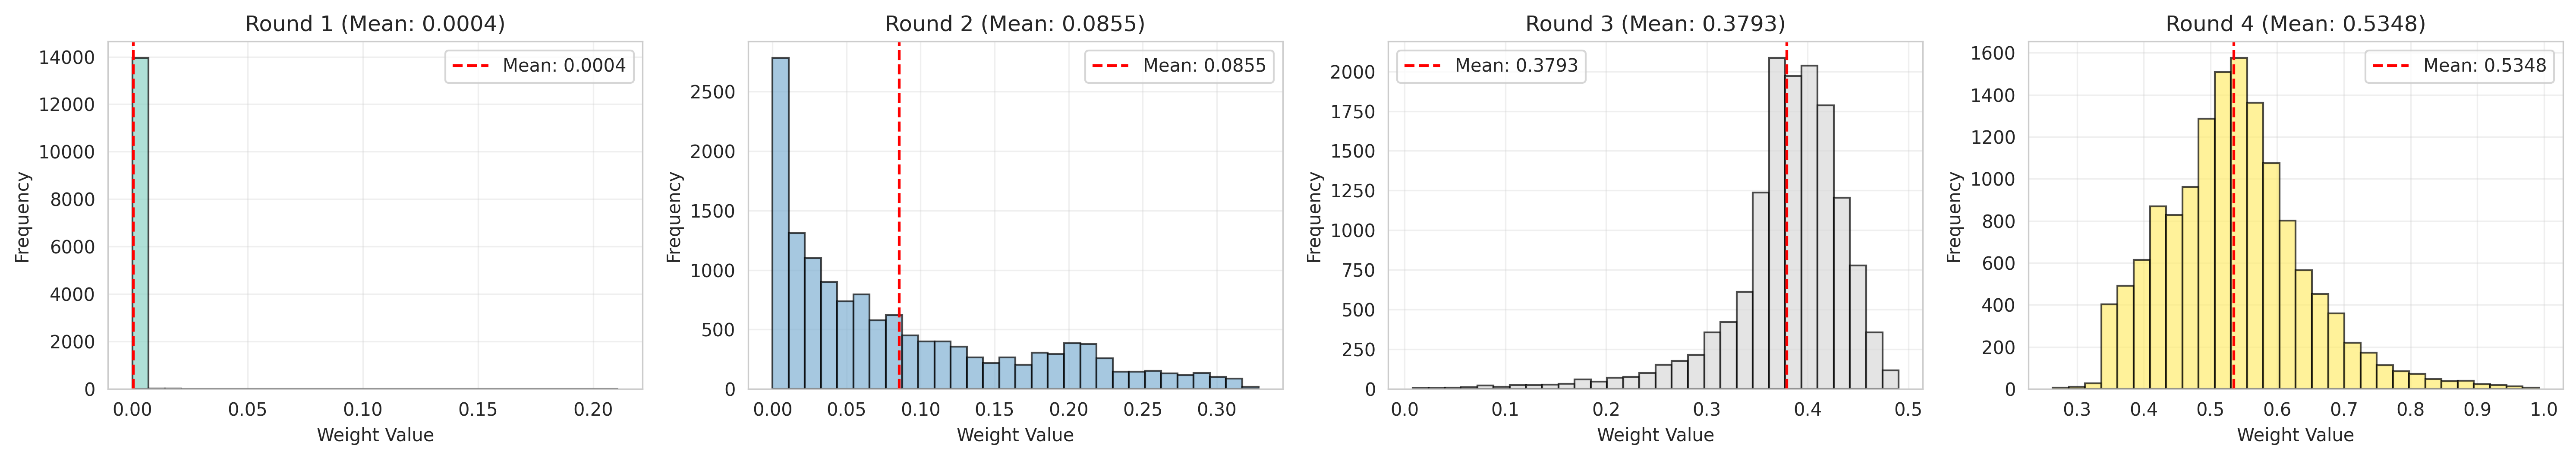
The image presents four histograms, each displaying the distribution of "Weight Value" for a different "Round" (1 through 4). Each histogram also shows the mean weight value for that round, indicated by a vertical dashed red line and a corresponding label. The x-axis represents "Weight Value," and the y-axis represents "Frequency."
### Components/Axes
* **X-axis (Weight Value):**
* Round 1: 0.00 to 0.20, increment 0.05
* Round 2: 0.00 to 0.30, increment 0.05
* Round 3: 0.0 to 0.5, increment 0.1
* Round 4: 0.3 to 1.0, increment 0.1
* **Y-axis (Frequency):**
* Round 1: 0 to 14000, increment 2000
* Round 2: 0 to 2500, increment 500
* Round 3: 0 to 2000, increment 250
* Round 4: 0 to 1600, increment 200
* **Titles:** Each histogram is titled "Round X (Mean: Y)", where X is the round number (1-4) and Y is the mean weight value for that round.
* **Mean Line:** A vertical dashed red line indicates the mean weight value for each round. A label "Mean: Y" is placed near the top-right of each histogram, where Y is the mean weight value.
### Detailed Analysis
* **Round 1 (Mean: 0.0004):**
* Color: Light Green
* The distribution is heavily skewed to the left, with almost all weight values concentrated near 0.00.
* The frequency at 0.00 is approximately 14000.
* The mean is very close to zero (0.0004), as indicated by the red dashed line.
* **Round 2 (Mean: 0.0855):**
* Color: Light Blue
* The distribution is skewed to the right.
* The highest frequency is at approximately 0.00, with a frequency of approximately 800.
* The frequency decreases as the weight value increases.
* The mean is 0.0855, as indicated by the red dashed line.
* **Round 3 (Mean: 0.3793):**
* Color: Light Gray
* The distribution is approximately normal, centered around 0.4.
* The frequency increases from 0.0 to approximately 0.4, then decreases.
* The mean is 0.3793, as indicated by the red dashed line.
* **Round 4 (Mean: 0.5348):**
* Color: Light Yellow
* The distribution is approximately normal, centered around 0.5.
* The frequency increases from 0.3 to approximately 0.5, then decreases.
* The mean is 0.5348, as indicated by the red dashed line.
### Key Observations
* The mean weight value increases from Round 1 to Round 4.
* The distribution of weight values shifts from being heavily skewed to the left in Round 1 to a more normal distribution in Rounds 3 and 4.
* The spread of weight values increases from Round 1 to Rounds 2, 3, and 4.
### Interpretation
The histograms illustrate how the distribution of weight values changes over the four rounds. The increasing mean weight value suggests that the model or process is learning and adjusting the weights. The shift from a heavily skewed distribution in Round 1 to a more normal distribution in later rounds indicates that the weights are becoming more diverse and less concentrated at a single value. This could be indicative of a learning process where the model initially focuses on a small subset of features (Round 1) and gradually expands to consider a wider range of features (Rounds 2-4).