\n
## Histograms: Weight Value Distribution Across Rounds
### Overview
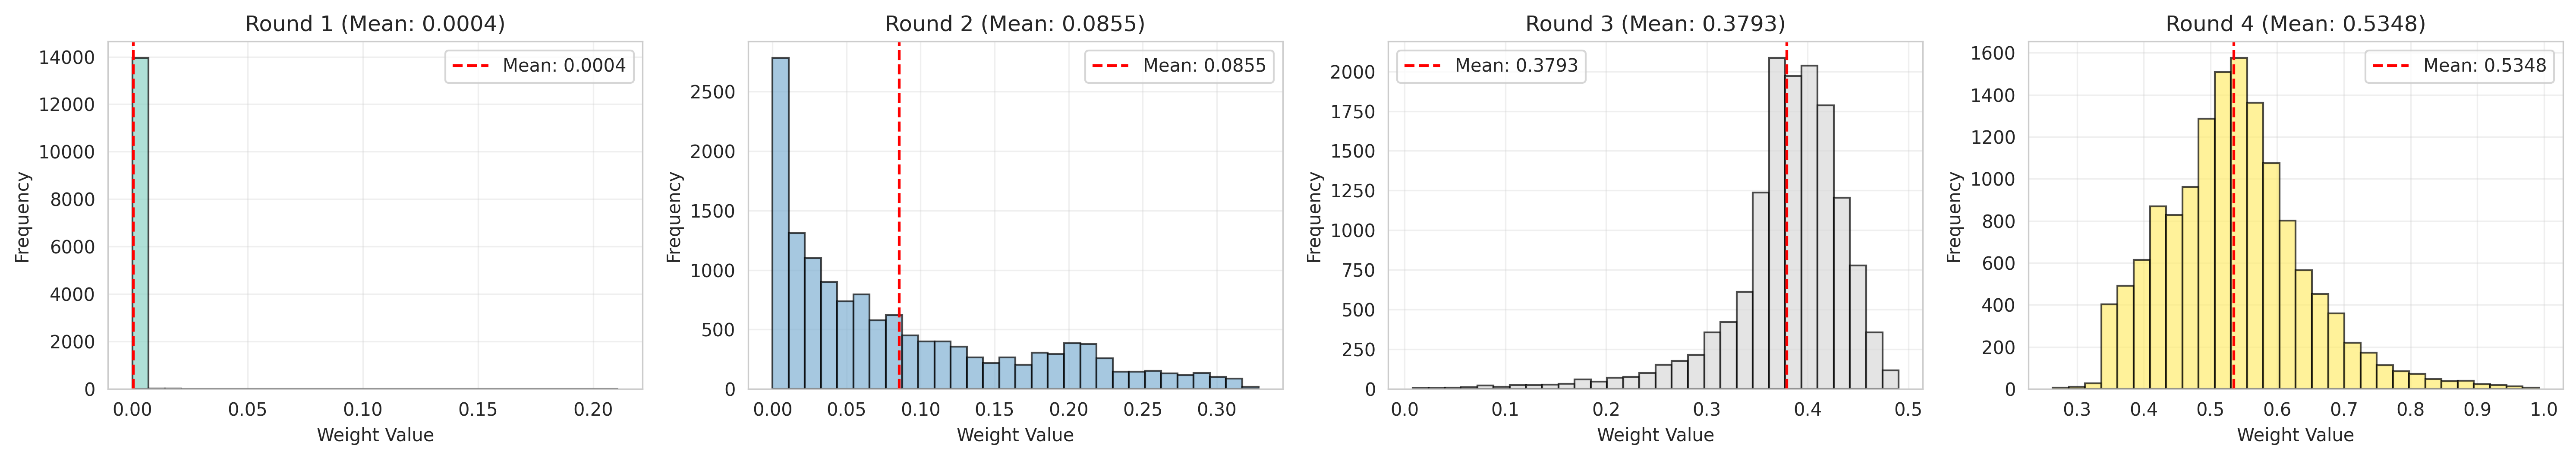
The image presents four histograms, each representing the distribution of "Weight Value" across four rounds of a process. Each histogram displays the frequency of different weight values. A vertical dashed red line indicates the mean weight value for each round.
### Components/Axes
Each histogram shares the following components:
* **X-axis:** Labeled "Weight Value", ranging from 0.00 to approximately 1.0.
* **Y-axis:** Labeled "Frequency", ranging from 0 to approximately 14000 (varying slightly between histograms).
* **Title:** Indicates the round number and the mean weight value for that round.
* **Mean Indicator:** A vertical dashed red line, labeled "Mean: [value]".
The four rounds and their corresponding mean values are:
* Round 1: Mean = 0.0004
* Round 2: Mean = 0.0855
* Round 3: Mean = 0.3793
* Round 4: Mean = 0.5348
### Detailed Analysis or Content Details
**Round 1:**
The distribution is heavily skewed to the left. The majority of weight values are clustered very close to 0.0. The frequency peaks at approximately 12000 at a weight value of around 0.01. The distribution rapidly declines as the weight value increases.
**Round 2:**
The distribution is still skewed to the right, but less so than Round 1. The peak frequency is around 2500, occurring at a weight value of approximately 0.04. The distribution extends further to the right, with a long tail.
**Round 3:**
The distribution is more symmetrical and centered around a higher weight value. The peak frequency is approximately 750, occurring at a weight value of around 0.35. The distribution is broader than in Rounds 1 and 2.
**Round 4:**
The distribution is approximately normal and centered around a weight value of approximately 0.7. The peak frequency is around 1400, occurring at a weight value of approximately 0.75. The distribution is relatively compact.
### Key Observations
* The mean weight value increases significantly with each round.
* The distribution shifts to the right with each round, indicating an overall increase in weight values.
* The shape of the distribution changes from heavily skewed to approximately normal as the rounds progress.
* The spread of the distribution (variance) appears to increase initially and then stabilize.
### Interpretation
The data suggests a process where weight values are iteratively increased over four rounds. The initial round starts with very low weight values, and the process gradually increases these values, leading to a more symmetrical and higher-valued distribution in the final round. This could represent a learning process, an optimization algorithm, or a selection process where weights are adjusted over time.
The shift in distribution shape indicates that the process is becoming more stable and predictable as the rounds progress. The initial skewness suggests a high degree of variability and uncertainty, while the approximate normality in Round 4 suggests that the weight values are converging towards a central tendency.
The increasing mean values demonstrate a clear trend of weight accumulation or growth across the rounds. The absence of significant outliers suggests that the process is relatively consistent and does not produce extreme weight values.