## Diagram: Distributed Computing Architecture for Parameter Replication and Accuracy Distribution
### Overview
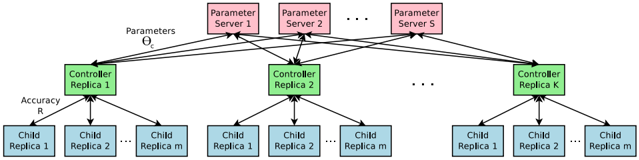
The diagram illustrates a hierarchical distributed system architecture with three primary components: **Parameter Servers** (pink), **Controller Replicas** (green), and **Child Replicas** (blue). Arrows indicate data flow, with Parameter Servers feeding parameters to Controller Replicas, which then distribute "Accuracy R" to Child Replicas. The structure suggests a master-slave or distributed training framework.
### Components/Axes
1. **Parameter Servers** (Top Layer):
- Labeled as "Parameter Server 1," "Parameter Server 2," ..., "Parameter Server S."
- Positioned at the top of the hierarchy, connected via bidirectional arrows to all Controller Replicas.
- Represent centralized parameter storage or aggregation nodes.
2. **Controller Replicas** (Middle Layer):
- Labeled as "Controller Replica 1," "Controller Replica 2," ..., "Controller Replica K."
- Positioned centrally, connected to Parameter Servers (incoming arrows) and Child Replicas (outgoing arrows).
- Act as intermediaries for parameter distribution and accuracy computation.
3. **Child Replicas** (Bottom Layer):
- Labeled as "Child Replica 1," "Child Replica 2," ..., "Child Replica m" under each Controller Replica.
- Positioned at the bottom, receiving "Accuracy R" from their respective Controller Replica.
- Likely represent worker nodes performing localized computations.
4. **Data Flow**:
- **Parameters (θ_c)**: Flow from Parameter Servers to Controller Replicas (solid black arrows).
- **Accuracy R**: Flow from Controller Replicas to Child Replicas (dashed black arrows).
### Detailed Analysis
- **Parameter Servers**:
- Total of **S servers** (exact count unspecified, denoted as "S").
- Each server connects to **all K Controller Replicas**, indicating full parameter replication across controllers.
- Example: Parameter Server 1 → Controller Replica 1, 2, ..., K.
- **Controller Replicas**:
- Total of **K replicas** (exact count unspecified, denoted as "K").
- Each Controller Replica connects to **m Child Replicas** (exact count unspecified, denoted as "m").
- Example: Controller Replica 1 → Child Replica 1, 2, ..., m.
- **Child Replicas**:
- Total of **m replicas per Controller** (exact count unspecified, denoted as "m").
- Each Child Replica receives "Accuracy R" from its parent Controller Replica.
### Key Observations
1. **Hierarchical Structure**:
- Parameter Servers → Controller Replicas → Child Replicas forms a top-down hierarchy.
- Suggests a centralized parameter management system with decentralized execution.
2. **Redundancy**:
- Multiple Parameter Servers (S) and Controller Replicas (K) imply fault tolerance.
- Child Replicas (m) under each Controller enable parallel processing.
3. **Data Flow Symmetry**:
- Parameters flow unidirectionally from Parameter Servers to Controllers.
- Accuracy R flows unidirectionally from Controllers to Child Replicas.
### Interpretation
This architecture aligns with **distributed machine learning frameworks** (e.g., parameter server-based training). Key insights:
- **Parameter Servers** act as a centralized repository for shared model parameters (θ_c), critical for synchronization in distributed training.
- **Controller Replicas** aggregate parameters and compute "Accuracy R," likely representing validation metrics or loss values.
- **Child Replicas** execute localized training or inference tasks, using parameters from their Controller Replica.
- The use of multiple replicas (K, m) suggests scalability and resilience against node failures.
The diagram emphasizes **asynchronous communication** (dashed arrows for Accuracy R) and **full parameter replication** (solid arrows for θ_c), common in systems prioritizing consistency over latency. The absence of numerical values implies a conceptual model rather than a performance benchmark.