## Diagram: Distributed System Architecture
### Overview
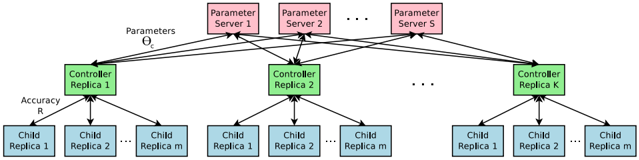
The image depicts a distributed system architecture with three tiers: Parameter Servers, Controller Replicas, and Child Replicas. The diagram illustrates the flow of parameters and accuracy between these tiers.
### Components/Axes
* **Top Tier:** Parameter Servers (pink boxes) labeled "Parameter Server 1", "Parameter Server 2", and "Parameter Server S".
* **Middle Tier:** Controller Replicas (green boxes) labeled "Controller Replica 1", "Controller Replica 2", and "Controller Replica K".
* **Bottom Tier:** Child Replicas (light blue boxes) labeled "Child Replica 1", "Child Replica 2", and "Child Replica m".
* **Parameters:** Labeled as "Parameters" and denoted by "Θc" (Theta c), flowing from the Parameter Servers to the Controller Replicas.
* **Accuracy:** Labeled as "Accuracy" and denoted by "R", flowing from the Child Replicas to the Controller Replicas.
* Ellipses ("...") are used to indicate that there are more Controller Replicas and Child Replicas than explicitly shown.
### Detailed Analysis
* **Parameter Servers:** There are 'S' number of parameter servers. Each parameter server sends parameters (Θc) to each of the controller replicas.
* **Controller Replicas:** There are 'K' number of controller replicas. Each controller replica receives parameters from all parameter servers and accuracy information from its associated child replicas.
* **Child Replicas:** Each controller replica has 'm' number of child replicas associated with it. Each child replica sends accuracy information (R) to its respective controller replica.
* **Connections:**
* Each Parameter Server is connected to every Controller Replica.
* Each Controller Replica is connected to its 'm' Child Replicas.
### Key Observations
* The architecture is hierarchical, with Parameter Servers at the top, Controller Replicas in the middle, and Child Replicas at the bottom.
* The system is distributed, with multiple replicas of both Controllers and Child processes.
* The diagram highlights the flow of parameters from the Parameter Servers to the Controller Replicas and the flow of accuracy information from the Child Replicas to the Controller Replicas.
### Interpretation
The diagram illustrates a distributed machine learning or optimization system. Parameter Servers likely hold model parameters, Controller Replicas manage and coordinate the learning process, and Child Replicas perform computations or data processing. The flow of parameters (Θc) from the Parameter Servers to the Controller Replicas suggests a model distribution or parameter update mechanism. The flow of accuracy information (R) from the Child Replicas to the Controller Replicas indicates a feedback loop for evaluating performance and guiding the learning process. The replication of Controllers and Child processes suggests a design for scalability and fault tolerance. The architecture allows for parallel processing and distributed learning, potentially enabling faster training and better performance on large datasets.