# Technical Document Extraction: Line Chart Analysis
## Chart Overview
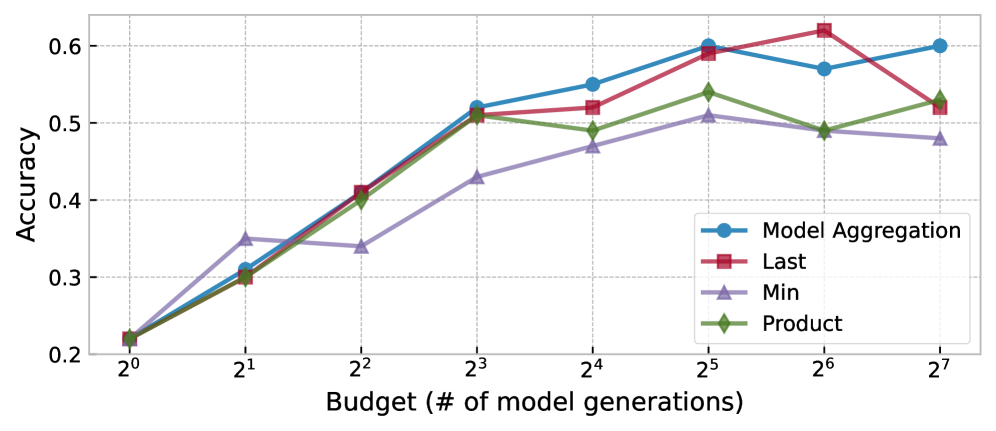
The image depicts a **line chart** comparing the performance of four distinct methodologies across varying computational budgets. The chart uses logarithmic scaling on the x-axis (budget) and linear scaling on the y-axis (accuracy).
---
### Axis Labels and Markers
- **X-axis**:
- Title: `Budget (# of model generations)`
- Labels: `2⁰`, `2¹`, `2²`, `2³`, `2⁴`, `2⁵`, `2⁶`, `2⁷`
- Tick marks: Dashed vertical lines at each label position.
- **Y-axis**:
- Title: `Accuracy`
- Labels: `0.2`, `0.3`, `0.4`, `0.5`, `0.6`
- Tick marks: Dashed horizontal lines at each label position.
---
### Legend
- **Location**: Bottom-right corner of the chart.
- **Entries**:
1. **Model Aggregation** (blue circles)
2. **Last** (red squares)
3. **Min** (purple triangles)
4. **Product** (green diamonds)
---
### Data Series Analysis
#### 1. **Model Aggregation** (Blue Circles)
- **Trend**:
- Starts at `0.2` (2⁰), rises steadily to a peak of `0.6` at `2⁵`, then declines slightly to `0.6` at `2⁷`.
- **Key Points**:
- `2⁰`: `0.2`
- `2¹`: `0.3`
- `2²`: `0.4`
- `2³`: `0.52`
- `2⁴`: `0.55`
- `2⁵`: `0.6`
- `2⁶`: `0.57`
- `2⁷`: `0.6`
#### 2. **Last** (Red Squares)
- **Trend**:
- Begins at `0.2` (2⁰), rises sharply to `0.62` at `2⁶`, then drops to `0.52` at `2⁷`.
- **Key Points**:
- `2⁰`: `0.2`
- `2¹`: `0.3`
- `2²`: `0.4`
- `2³`: `0.51`
- `2⁴`: `0.52`
- `2⁵`: `0.6`
- `2⁶`: `0.62`
- `2⁷`: `0.52`
#### 3. **Min** (Purple Triangles)
- **Trend**:
- Starts at `0.2` (2⁰), rises steadily to `0.51` at `2⁵`, then declines slightly to `0.48` at `2⁷`.
- **Key Points**:
- `2⁰`: `0.2`
- `2¹`: `0.3`
- `2²`: `0.3`
- `2³`: `0.43`
- `2⁴`: `0.47`
- `2⁵`: `0.51`
- `2⁶`: `0.49`
- `2⁷`: `0.48`
#### 4. **Product** (Green Diamonds)
- **Trend**:
- Begins at `0.2` (2⁰), rises sharply to `0.55` at `2⁵`, then fluctuates between `0.49` and `0.53` at `2⁶` and `2⁷`.
- **Key Points**:
- `2⁰`: `0.2`
- `2¹`: `0.3`
- `2²`: `0.4`
- `2³`: `0.51`
- `2⁴`: `0.5`
- `2⁵`: `0.55`
- `2⁶`: `0.49`
- `2⁷`: `0.53`
---
### Cross-Reference Validation
- **Legend Consistency**:
- All line colors and markers match the legend entries (e.g., blue circles = Model Aggregation).
- **Spatial Grounding**:
- Legend positioned at `[x=0.85, y=0.15]` (normalized coordinates).
---
### Observations
1. **Model Aggregation** and **Product** show the most consistent growth, with **Model Aggregation** achieving the highest peak accuracy (`0.6`).
2. **Last** exhibits the sharpest rise but experiences a notable drop after `2⁶`.
3. **Min** demonstrates the least variability but also the lowest peak accuracy.
---
### Notes
- No non-English text or additional data tables are present.
- The chart focuses on logarithmic budget scaling, emphasizing efficiency gains across exponential increases in computational resources.