# Technical Data Extraction: Model Accuracy vs. Budget
## 1. Image Overview
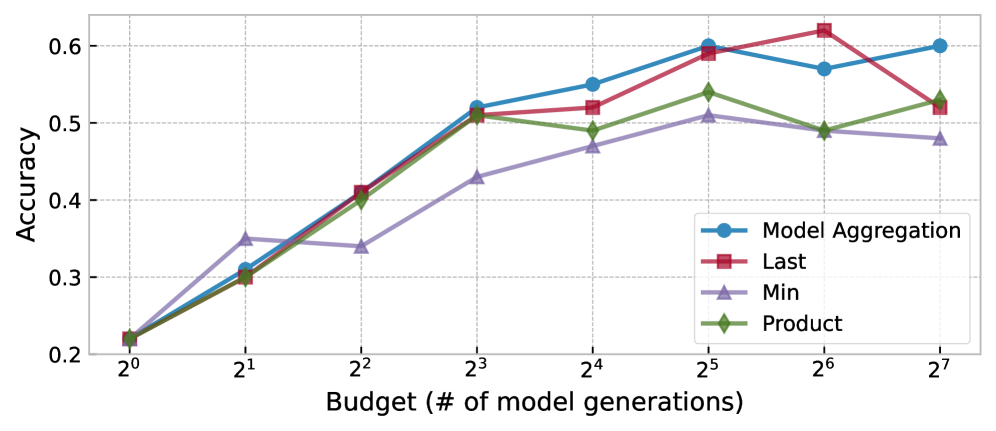
This image is a line graph illustrating the relationship between a computational budget (measured in the number of model generations) and the resulting accuracy of four different methodologies. The chart uses a logarithmic scale for the x-axis and a linear scale for the y-axis.
## 2. Component Isolation
### A. Header/Axes
* **Y-Axis Label:** "Accuracy" (Vertical, left-aligned).
* **Y-Axis Scale:** Linear, ranging from 0.2 to 0.6 with major ticks at intervals of 0.1.
* **X-Axis Label:** "Budget (# of model generations)" (Horizontal, bottom-centered).
* **X-Axis Scale:** Logarithmic (base 2), ranging from $2^0$ to $2^7$.
* **Grid:** Light gray dashed grid lines corresponding to both x and y axis markers.
### B. Legend (Spatial Grounding: Bottom Right)
The legend is located in the lower-right quadrant of the plot area.
* **Blue line with Circle markers ($\bullet$):** Model Aggregation
* **Red line with Square markers ($\blacksquare$):** Last
* **Purple line with Triangle markers ($\blacktriangle$):** Min
* **Green line with Diamond markers ($\blacksquare$):** Product
---
## 3. Data Series Analysis and Trend Verification
### Series 1: Model Aggregation (Blue, Circle)
* **Trend:** Shows a consistent upward trajectory with high stability. It starts at the lowest point and ends as the highest-performing method at the maximum budget.
* **Data Points (Approximate):**
* $2^0$: 0.22
* $2^1$: 0.31
* $2^2$: 0.41
* $2^3$: 0.52
* $2^4$: 0.55
* $2^5$: 0.60
* $2^6$: 0.57
* $2^7$: 0.60
### Series 2: Last (Red, Square)
* **Trend:** Generally upward but exhibits significant volatility at higher budgets. It reaches the absolute peak accuracy of the chart at $2^6$ before dropping sharply.
* **Data Points (Approximate):**
* $2^0$: 0.22
* $2^1$: 0.30
* $2^2$: 0.41
* $2^3$: 0.51
* $2^4$: 0.52
* $2^5$: 0.59
* $2^6$: 0.62 (Peak)
* $2^7$: 0.52
### Series 3: Min (Purple, Triangle)
* **Trend:** The lowest-performing series overall. It shows an initial jump at $2^1$, plateaus/dips at $2^2$, and then follows a slow upward trend that tapers off after $2^5$.
* **Data Points (Approximate):**
* $2^0$: 0.22
* $2^1$: 0.35
* $2^2$: 0.34
* $2^3$: 0.43
* $2^4$: 0.47
* $2^5$: 0.51
* $2^6$: 0.49
* $2^7$: 0.48
### Series 4: Product (Green, Diamond)
* **Trend:** Closely tracks the "Last" and "Model Aggregation" series in the early stages ($2^0$ to $2^3$). It underperforms compared to the top two series in the later stages, showing a peak at $2^5$ followed by a decline and slight recovery.
* **Data Points (Approximate):**
* $2^0$: 0.22
* $2^1$: 0.30
* $2^2$: 0.40
* $2^3$: 0.51
* $2^4$: 0.49
* $2^5$: 0.54
* $2^6$: 0.49
* $2^7$: 0.53
---
## 4. Reconstructed Data Table (Estimated Values)
| Budget ($2^n$) | Model Aggregation (Blue) | Last (Red) | Min (Purple) | Product (Green) |
| :--- | :--- | :--- | :--- | :--- |
| **$2^0$ (1)** | 0.22 | 0.22 | 0.22 | 0.22 |
| **$2^1$ (2)** | 0.31 | 0.30 | 0.35 | 0.30 |
| **$2^2$ (4)** | 0.41 | 0.41 | 0.34 | 0.40 |
| **$2^3$ (8)** | 0.52 | 0.51 | 0.43 | 0.51 |
| **$2^4$ (16)** | 0.55 | 0.52 | 0.47 | 0.49 |
| **$2^5$ (32)** | 0.60 | 0.59 | 0.51 | 0.54 |
| **$2^6$ (64)** | 0.57 | 0.62 | 0.49 | 0.49 |
| **$2^7$ (128)** | 0.60 | 0.52 | 0.48 | 0.53 |
## 5. Key Observations
* **Convergence:** All methods start at the same accuracy (~0.22) when the budget is $2^0$.
* **Top Performer:** "Model Aggregation" appears to be the most robust method, ending with the highest accuracy at the largest budget and showing less volatility than "Last".
* **Volatility:** The "Last" method shows the highest peak accuracy but suffers from a significant performance drop-off after $2^6$ generations.
* **Scaling:** Accuracy for all methods improves significantly as the budget increases from $2^0$ to $2^3$, after which the gains become more marginal or inconsistent.