\n
## Heatmap: AUROC for Projections Aᵀt
### Overview
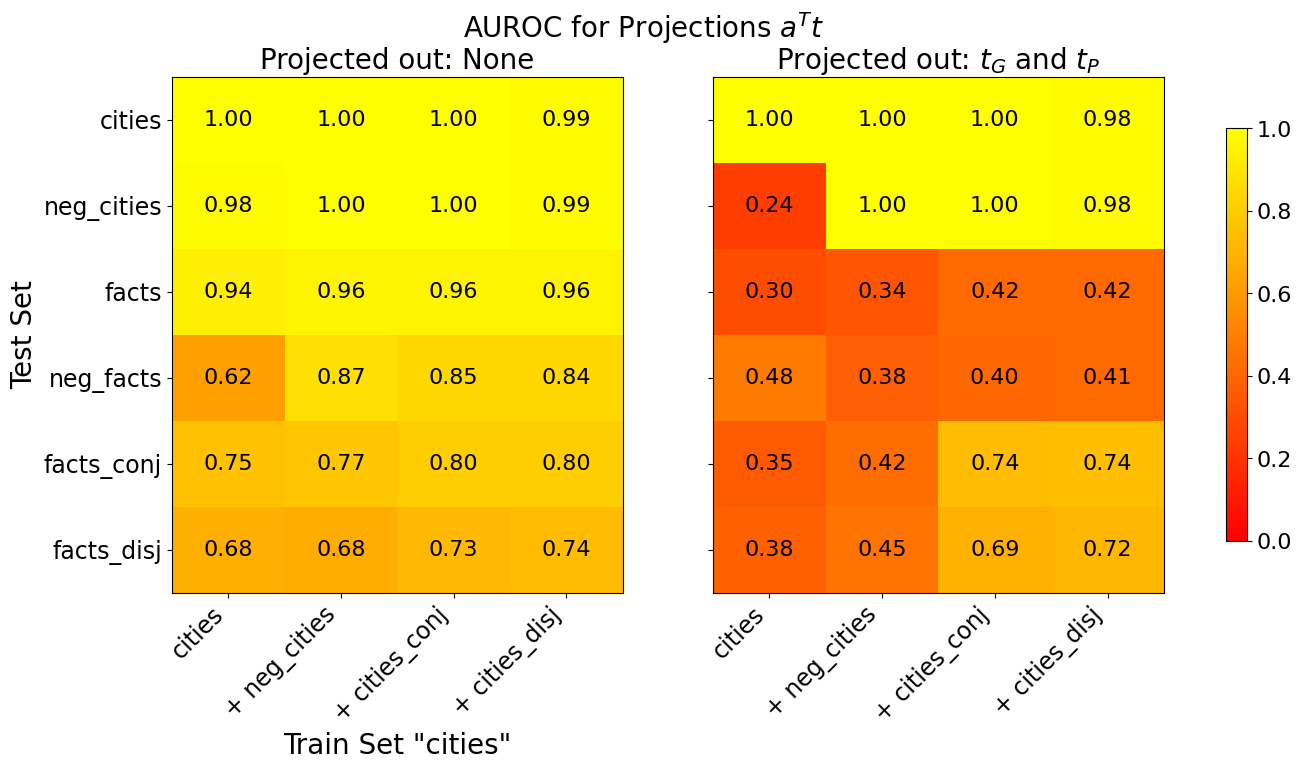
The image presents two heatmaps displaying Area Under the Receiver Operating Characteristic curve (AUROC) values for different combinations of train and test sets. The heatmaps compare performance when projecting out different variables. The first heatmap shows results when no variables are projected out ("Projected out: None"), while the second shows results when variables *t<sub>G</sub>* and *t<sub>P</sub>* are projected out ("Projected out: t<sub>G</sub> and t<sub>P</sub>").
### Components/Axes
* **Title:** "AUROC for Projections Aᵀt" (centered at the top)
* **Subtitles:** "Projected out: None" (top-left) and "Projected out: t<sub>G</sub> and t<sub>P</sub>" (top-right)
* **X-axis Label:** "Train Set 'cities'" (bottom-center)
* **Y-axis Label:** "Test Set" (left-center)
* **X-axis Categories:** "cities", "+ neg\_cities", "+ cities\_conj", "+ cities\_disj"
* **Y-axis Categories:** "cities", "neg\_cities", "facts", "neg\_facts", "facts\_conj", "facts\_disj"
* **Colorbar:** A vertical colorbar on the right side, ranging from dark red (approximately 0.0) to bright yellow (approximately 1.0).
* **Color Scale:** The colorbar indicates that higher AUROC values are represented by yellow, and lower values by red.
### Detailed Analysis
**Heatmap 1: Projected out: None**
This heatmap shows generally high AUROC values, indicating good performance across most train/test set combinations.
* **cities vs. cities:** 1.00
* **cities vs. + neg\_cities:** 1.00
* **cities vs. + cities\_conj:** 1.00
* **cities vs. + cities\_disj:** 0.99
* **neg\_cities vs. cities:** 0.98
* **neg\_cities vs. + neg\_cities:** 1.00
* **neg\_cities vs. + cities\_conj:** 1.00
* **neg\_cities vs. + cities\_disj:** 0.99
* **facts vs. cities:** 0.94
* **facts vs. + neg\_cities:** 0.96
* **facts vs. + cities\_conj:** 0.96
* **facts vs. + cities\_disj:** 0.96
* **neg\_facts vs. cities:** 0.62
* **neg\_facts vs. + neg\_cities:** 0.87
* **neg\_facts vs. + cities\_conj:** 0.85
* **neg\_facts vs. + cities\_disj:** 0.84
* **facts\_conj vs. cities:** 0.75
* **facts\_conj vs. + neg\_cities:** 0.77
* **facts\_conj vs. + cities\_conj:** 0.80
* **facts\_conj vs. + cities\_disj:** 0.80
* **facts\_disj vs. cities:** 0.68
* **facts\_disj vs. + neg\_cities:** 0.68
* **facts\_disj vs. + cities\_conj:** 0.73
* **facts\_disj vs. + cities\_disj:** 0.74
**Heatmap 2: Projected out: t<sub>G</sub> and t<sub>P</sub>**
This heatmap shows significantly lower AUROC values in many cases, particularly when "facts" or "neg\_facts" are in the test set.
* **cities vs. cities:** 1.00
* **cities vs. + neg\_cities:** 0.24
* **cities vs. + cities\_conj:** 1.00
* **cities vs. + cities\_disj:** 0.98
* **neg\_cities vs. cities:** 1.00
* **neg\_cities vs. + neg\_cities:** 1.00
* **neg\_cities vs. + cities\_conj:** 0.42
* **neg\_cities vs. + cities\_disj:** 0.42
* **facts vs. cities:** 0.30
* **facts vs. + neg\_cities:** 0.34
* **facts vs. + cities\_conj:** 0.42
* **facts vs. + cities\_disj:** 0.42
* **neg\_facts vs. cities:** 0.48
* **neg\_facts vs. + neg\_cities:** 0.38
* **neg\_facts vs. + cities\_conj:** 0.40
* **neg\_facts vs. + cities\_disj:** 0.41
* **facts\_conj vs. cities:** 0.35
* **facts\_conj vs. + neg\_cities:** 0.42
* **facts\_conj vs. + cities\_conj:** 0.74
* **facts\_conj vs. + cities\_disj:** 0.74
* **facts\_disj vs. cities:** 0.38
* **facts\_disj vs. + neg\_cities:** 0.45
* **facts\_disj vs. + cities\_conj:** 0.69
* **facts\_disj vs. + cities\_disj:** 0.72
### Key Observations
* Projecting out *t<sub>G</sub>* and *t<sub>P</sub>* significantly reduces performance, especially when dealing with "facts" and "neg\_facts" in the test set.
* The highest AUROC values are consistently observed when the train and test sets both involve "cities" or "neg\_cities" when no variables are projected out.
* The "neg\_facts" test set consistently shows lower AUROC values than other test sets, even when no variables are projected out.
### Interpretation
The data suggests that the variables *t<sub>G</sub>* and *t<sub>P</sub>* are crucial for maintaining performance when dealing with "facts" and "neg\_facts". Removing these variables leads to a substantial drop in AUROC, indicating that they contain important information for distinguishing between these categories. The consistently lower performance with "neg\_facts" suggests that this category is inherently more difficult to classify, even without projecting out any variables. The high performance when using "cities" and "neg\_cities" suggests that the model is very effective at distinguishing between these categories, and that the projections are less important in these cases. The difference between the two heatmaps highlights the importance of feature selection and the potential impact of removing key variables from the model. The use of "+" prefixes on the x-axis categories likely indicates some form of data augmentation or combination of features. Further investigation into the nature of *t<sub>G</sub>* and *t<sub>P</sub>* and the construction of the augmented features would be beneficial.