\n
## Heatmap Chart: AUROC for Projections \( a^T t \)
### Overview
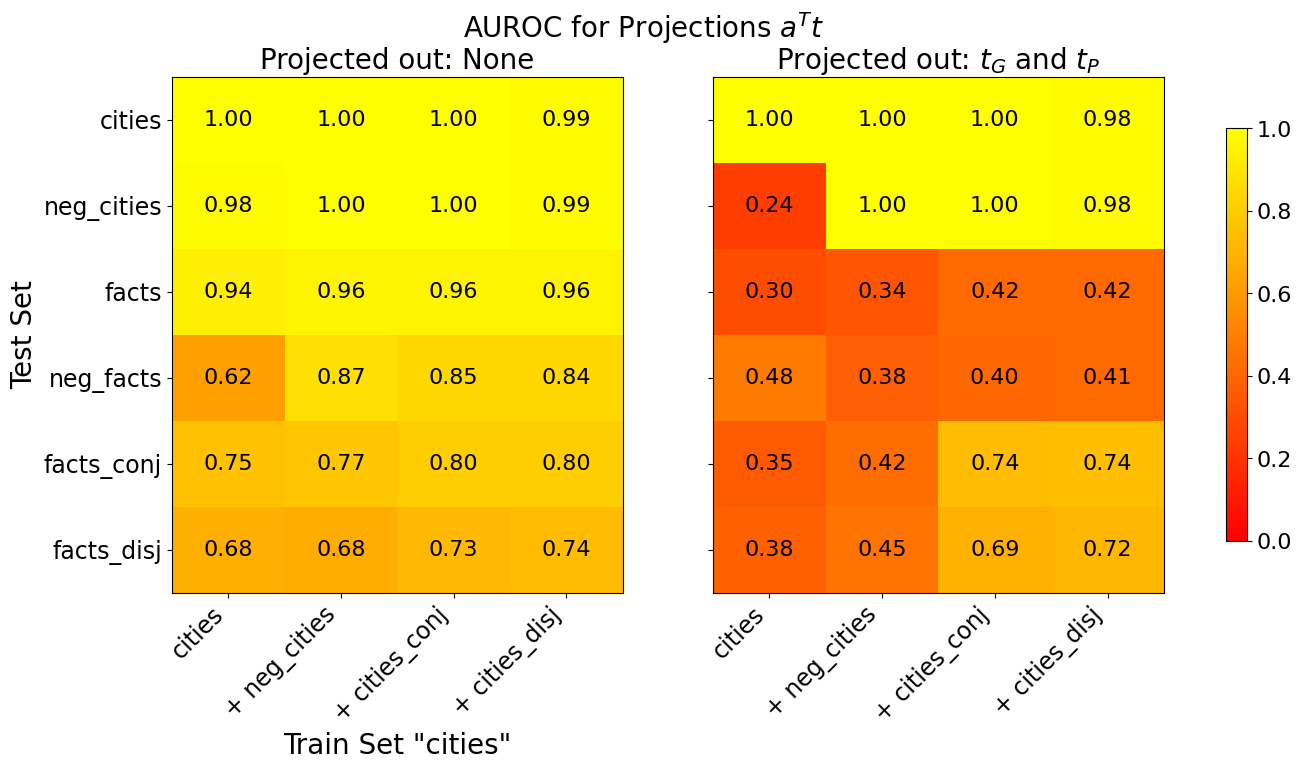
The image displays two side-by-side heatmaps comparing the Area Under the Receiver Operating Characteristic curve (AUROC) for different projection conditions. The overall title is "AUROC for Projections \( a^T t \)". The left heatmap shows results when "Projected out: None", and the right heatmap shows results when "Projected out: \( t_G \) and \( t_P \)". A shared color bar on the far right indicates the AUROC scale, ranging from 0.0 (dark red) to 1.0 (bright yellow).
### Components/Axes
* **Main Title:** "AUROC for Projections \( a^T t \)"
* **Subplot Titles:**
* Left: "Projected out: None"
* Right: "Projected out: \( t_G \) and \( t_P \)"
* **Y-Axis (Vertical, shared for both subplots):** Labeled "Test Set". The categories, from top to bottom, are:
1. `cities`
2. `neg_cities`
3. `facts`
4. `neg_facts`
5. `facts_conj`
6. `facts_disj`
* **X-Axis (Horizontal, shared for both subplots):** Labeled "Train Set 'cities'". The categories, from left to right, are:
1. `cities`
2. `+ neg_cities`
3. `+ cities_conj`
4. `+ cities_disj`
* **Color Bar (Legend):** Positioned vertically on the right edge of the image. It maps color to AUROC value, with tick marks at 0.0, 0.2, 0.4, 0.6, 0.8, and 1.0. The gradient runs from dark red (0.0) through orange to bright yellow (1.0).
### Detailed Analysis
**Left Heatmap ("Projected out: None")**
This matrix shows generally high AUROC values, indicated by the prevalence of yellow and light orange cells.
* **Row `cities`:** All values are very high. (cities: 1.00, + neg_cities: 1.00, + cities_conj: 1.00, + cities_disj: 0.99).
* **Row `neg_cities`:** Also very high. (cities: 0.98, + neg_cities: 1.00, + cities_conj: 1.00, + cities_disj: 0.99).
* **Row `facts`:** Consistently high. (cities: 0.94, + neg_cities: 0.96, + cities_conj: 0.96, + cities_disj: 0.96).
* **Row `neg_facts`:** Shows more variation. The value for the `cities` training set is notably lower (0.62) compared to the others in the row (0.87, 0.85, 0.84).
* **Row `facts_conj`:** Moderate to high values. (cities: 0.75, + neg_cities: 0.77, + cities_conj: 0.80, + cities_disj: 0.80).
* **Row `facts_disj`:** Moderate values. (cities: 0.68, + neg_cities: 0.68, + cities_conj: 0.73, + cities_disj: 0.74).
**Right Heatmap ("Projected out: \( t_G \) and \( t_P \)")**
This matrix shows a dramatic reduction in AUROC for most categories, indicated by the prevalence of orange and red cells, except for the top two rows.
* **Row `cities`:** Values remain very high, nearly identical to the left heatmap. (cities: 1.00, + neg_cities: 1.00, + cities_conj: 1.00, + cities_disj: 0.98).
* **Row `neg_cities`:** Shows a stark contrast. The value for the `cities` training set plummets to 0.24 (dark red), while the other three columns remain high (1.00, 1.00, 0.98).
* **Row `facts`:** All values drop significantly into the 0.30-0.42 range (orange).
* **Row `neg_facts`:** All values are low, ranging from 0.38 to 0.48 (orange/red).
* **Row `facts_conj`:** Values are low for the first two columns (0.35, 0.42) but recover to moderate levels for the last two (0.74, 0.74).
* **Row `facts_disj`:** Similar pattern to `facts_conj`. Low for the first two columns (0.38, 0.45), higher for the last two (0.69, 0.72).
### Key Observations
1. **Projection Impact:** Projecting out \( t_G \) and \( t_P \) causes a severe performance drop (lower AUROC) for test sets involving "facts" (`facts`, `neg_facts`, `facts_conj`, `facts_disj`) and for the `neg_cities` test set when trained only on `cities`.
2. **Resilient Performance:** The `cities` test set maintains near-perfect AUROC (~1.00) regardless of the projection or the training set composition. The `neg_cities` test set also maintains high performance if the training set includes `+ neg_cities`, `+ cities_conj`, or `+ cities_disj`.
3. **Training Set Effect:** In the right heatmap, for the `facts_conj` and `facts_disj` test sets, performance is notably better when the training set includes the corresponding conjunctive/disjunctive data (`+ cities_conj` or `+ cities_disj`) compared to training on just `cities` or `cities + neg_cities`.
4. **Worst-Case Scenario:** The single lowest AUROC value (0.24) occurs for the `neg_cities` test set under projection, when the model is trained only on the `cities` set.
### Interpretation
This chart likely evaluates how well a model's internal representations (projections \( a^T t \)) can distinguish between different types of test examples (e.g., cities vs. facts, positive vs. negative). The "Projected out" condition tests whether removing specific components of the representation (\( t_G \) and \( t_P \), possibly related to grammar and paraphrasing) affects this discriminative ability.
The data suggests that the representations for **city-related concepts** (`cities`, `neg_cities`) are robust and largely independent of \( t_G \) and \( t_P \). The model can distinguish them perfectly even after projection, provided the training data is sufficiently comprehensive.
In contrast, the representations for **fact-related concepts** appear to be **critically dependent** on the \( t_G \) and \( t_P \) components. Removing them collapses the model's ability to distinguish these test sets, as shown by the widespread low AUROC values in the right heatmap. This implies that the model's understanding of "facts" is heavily entangled with grammatical or paraphrasing information.
The recovery of performance for `facts_conj` and `facts_disj` test sets when trained on corresponding data (`+ cities_conj`, `+ cities_disj`) under projection indicates that the model can learn alternative, non-\( t_G \)/\( t_P \)-based representations for these logical constructs if explicitly trained on them. The chart thus reveals a fundamental difference in how the model encodes entity knowledge (cities) versus relational/logical knowledge (facts, conjunctions, disjunctions).