## Heatmap: AUROC for Projections a^Tt
### Overview
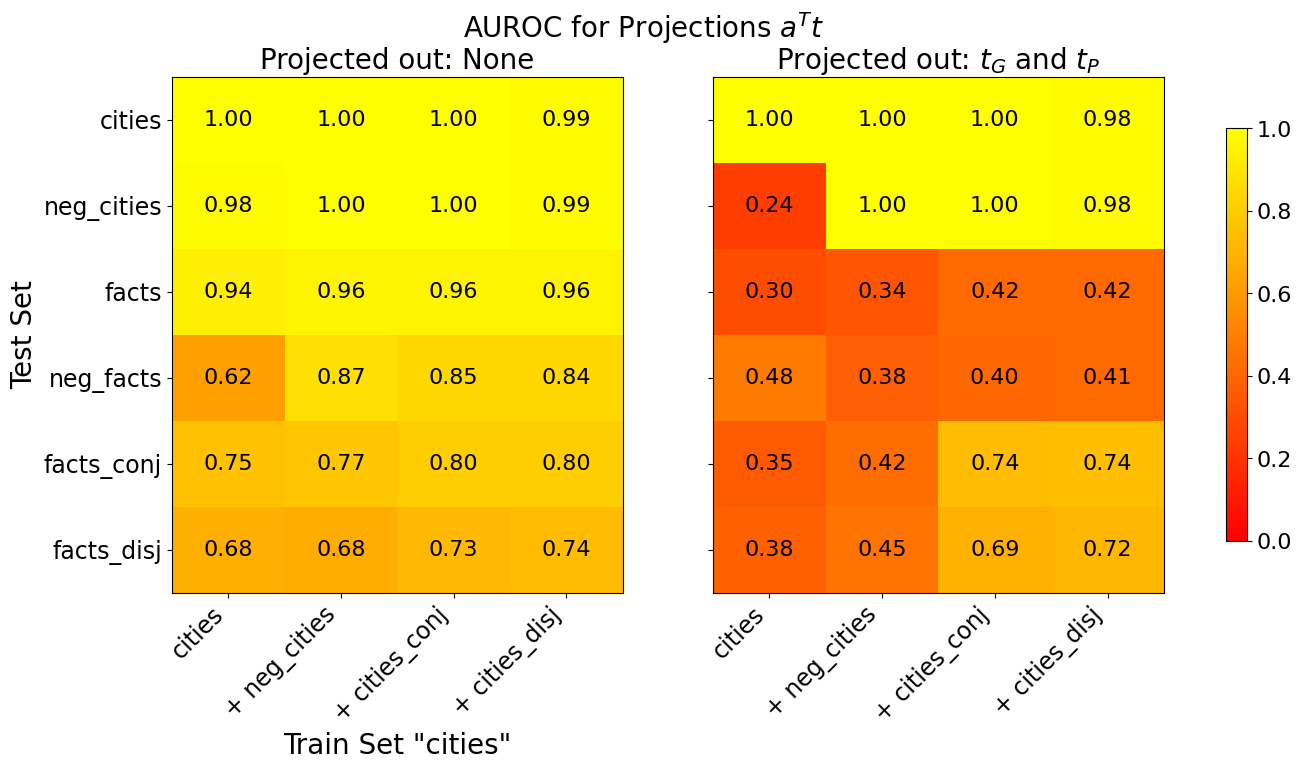
The image presents two side-by-side heatmaps comparing Area Under the Receiver Operating Characteristic (AUROC) values for different combinations of test and train sets under two projection scenarios: (1) no projections ("Projected out: None") and (2) projections of `t_G` and `t_P` ("Projected out: t_G and t_P"). AUROC values range from 0.0 (red) to 1.0 (yellow), with intermediate values in orange.
---
### Components/Axes
- **X-axis (Train Sets)**:
- `cities`
- `+ neg_cities`
- `+ cities_conj`
- `+ cities_disj`
- **Y-axis (Test Sets)**:
- `cities`
- `neg_cities`
- `facts`
- `neg_facts`
- `facts_conj`
- `facts_disj`
- **Legend**:
- Color scale from red (0.0) to yellow (1.0), with intermediate orange values.
- **Subsections**:
- Left: "Projected out: None"
- Right: "Projected out: t_G and t_P"
---
### Detailed Analysis
#### Left Heatmap ("Projected out: None")
- **Test Set Rows**:
- `cities`: All train sets show AUROC = 1.00 (yellow).
- `neg_cities`: AUROC = 0.98 (yellow) for `cities` and `+ neg_cities`; 1.00 for others.
- `facts`: AUROC = 0.94 (yellow) for `cities`; 0.96 for others.
- `neg_facts`: AUROC = 0.62 (orange) for `cities`; 0.87–0.85 for others.
- `facts_conj`: AUROC = 0.75–0.80 (orange-yellow).
- `facts_disj`: AUROC = 0.68–0.74 (orange).
#### Right Heatmap ("Projected out: t_G and t_P")
- **Test Set Rows**:
- `cities`: AUROC = 1.00 (yellow) for all train sets except `+ neg_cities` (0.98).
- `neg_cities`: AUROC = 0.24 (red) for `cities`; 1.00 for others.
- `facts`: AUROC = 0.30–0.42 (red-orange).
- `neg_facts`: AUROC = 0.38–0.41 (red-orange).
- `facts_conj`: AUROC = 0.35–0.74 (orange-yellow).
- `facts_disj`: AUROC = 0.38–0.72 (orange-yellow).
---
### Key Observations
1. **Projection Impact**:
- Projections (`t_G` and `t_P`) significantly reduce AUROC for `neg_cities`, `facts`, and `neg_facts` test sets.
- `cities` test set remains robust (AUROC ≥ 0.98) even with projections.
2. **Train Set Performance**:
- `cities_conj` and `cities_disj` train sets show mixed results under projections, with `facts_conj` and `facts_disj` test sets benefiting slightly.
3. **Color Consistency**:
- Yellow dominates the left heatmap (high AUROC), while the right heatmap shows more red/orange (lower AUROC).
---
### Interpretation
- **Projection Effects**: The introduction of `t_G` and `t_P` projections degrades model performance for negative or disjointed test sets (e.g., `neg_cities`, `facts_disj`), suggesting these projections introduce noise or reduce discriminative power.
- **Robustness of `cities`**: The `cities` test set maintains high AUROC in both scenarios, indicating it is less sensitive to projection artifacts.
- **Train Set Trade-offs**: While `cities_conj` and `cities_disj` train sets improve performance for some test sets (e.g., `facts_conj`), they underperform for others (e.g., `neg_cities`), highlighting context-dependent effectiveness.
This analysis underscores the importance of projection choice and train-test alignment in model evaluation.