## Line Graph: Fragment Count N vs. ASR and ACC
### Overview
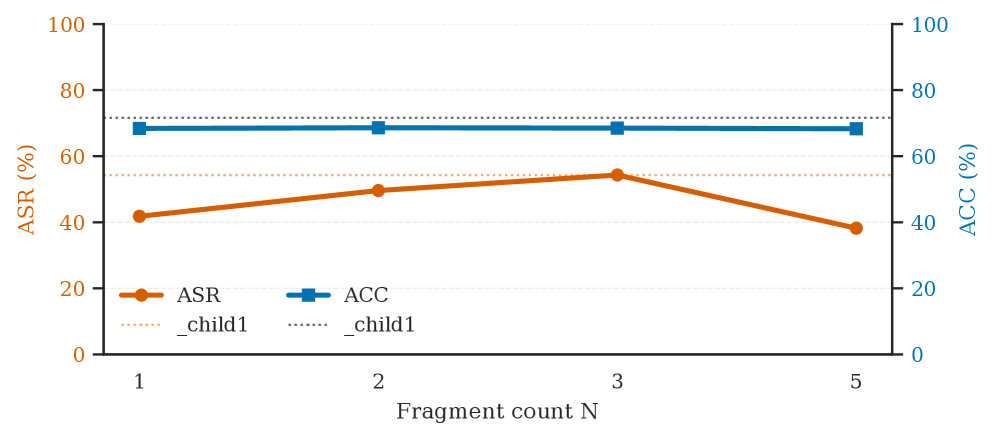
The image is a line graph comparing two metrics, **ASR (%)** (orange line) and **ACC (%)** (blue line), across different fragment counts (N = 1 to 5). The graph includes two y-axes: the left axis represents ASR (%), and the right axis represents ACC (%). Dashed horizontal lines at 55% and 75% are labeled "_child1" (likely indicating reference thresholds or benchmarks).
---
### Components/Axes
- **X-axis**: "Fragment count N" (values: 1, 2, 3, 5).
- **Y-axes**:
- Left: "ASR (%)" (0–100 scale).
- Right: "ACC (%)" (0–100 scale).
- **Legend**:
- Orange line: "ASR" (orange).
- Blue line: "ACC" (blue).
- **Dashed lines**:
- 55% (labeled "_child1").
- 75% (labeled "_child1").
---
### Detailed Analysis
#### ASR (%) (Orange Line)
- **N=1**: ~40% (data point at bottom of orange line).
- **N=2**: ~50% (data point at mid-level of orange line).
- **N=3**: ~55% (peak of orange line, aligning with the 55% dashed line).
- **N=5**: ~40% (data point at bottom of orange line).
- **Trend**: Increases from N=1 to N=3, then decreases sharply to N=5.
#### ACC (%) (Blue Line)
- **N=1**: ~70% (data point at mid-level of blue line).
- **N=2**: ~70% (data point at mid-level of blue line).
- **N=3**: ~70% (data point at mid-level of blue line).
- **N=5**: ~70% (data point at mid-level of blue line).
- **Trend**: Remains constant across all fragment counts.
#### Dashed Lines
- **55% (dashed orange)**: Aligns with the peak of ASR at N=3.
- **75% (dashed blue)**: Slightly above the ACC line, which remains at ~70% for all N.
---
### Key Observations
1. **ASR (%)** peaks at N=3 (55%) and declines to 40% at N=5, suggesting a non-linear relationship with fragment count.
2. **ACC (%)** remains stable at ~70% across all fragment counts, indicating robustness to fragmentation.
3. The 55% and 75% dashed lines may represent target thresholds for ASR and ACC, respectively.
4. The orange line (ASR) intersects the 55% dashed line at N=3, while the blue line (ACC) stays below the 75% dashed line.
---
### Interpretation
- **ASR (%)** likely represents a metric that improves with moderate fragmentation (N=3) but degrades at higher fragmentation (N=5). This could indicate an optimal fragmentation level for performance.
- **ACC (%)** remains consistently high, suggesting that the system or process being measured maintains accuracy regardless of fragmentation.
- The "_child1" labels on the dashed lines may denote reference values for comparison, though their exact meaning (e.g., benchmarks, error margins) is unclear without additional context.
- The divergence between ASR and ACC trends highlights a potential trade-off: while accuracy (ACC) is stable, the success rate (ASR) is sensitive to fragmentation levels.
This analysis suggests that fragment count N=3 may be optimal for maximizing ASR, while N=1–5 maintains high ACC. Further investigation into the system's design or constraints could clarify the significance of the "_child1" thresholds.