## 3D Pyramid Diagram: Geometric Structure with Color-Coded Edges
### Overview
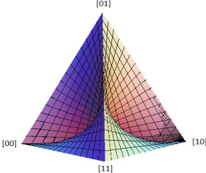
The image depicts a 3D pyramid with four triangular faces, labeled vertices, and color-coded edges. The pyramid is rendered with a grid overlay, and a color gradient transitions from blue to red across the structure. No explicit numerical data or legends are present, but the labels and color coding suggest a focus on geometric relationships or parameterized properties.
### Components/Axes
- **Vertices**:
- **[00]**: Bottom-left corner (blue-green edge).
- **[01]**: Top vertex (blue edge).
- **[10]**: Bottom-right corner (red edge).
- **[11]**: Bottom-back corner (purple edge).
- **Edges**:
- **[00]–[01]**: Blue (left face).
- **[01]–[10]**: Green (right face).
- **[10]–[11]**: Red (back face).
- **[11]–[00]**: Purple (base face).
- **Grid**: Black grid lines subdivide the faces, suggesting a coordinate system or measurement framework.
- **Color Gradient**: Smooth transition from blue (cool) to red (warm) across the pyramid, possibly indicating a scalar field (e.g., stress, temperature).
### Detailed Analysis
- **Vertex Labels**:
- **[00]**, **[01]**, **[10]**, and **[11]** are positioned at the pyramid’s corners. The labels use binary-like notation, potentially representing coordinates or states.
- **Edge Colors**:
- Blue ([00]–[01]) and green ([01]–[10]) dominate the front faces, while red ([10]–[11]) and purple ([11]–[00]) define the back and base. No legend explains the color coding, but the gradient implies a continuous variable.
- **Grid Overlay**:
- The grid is denser near the apex ([01]) and sparser at the base, possibly reflecting perspective distortion or a focus on upper regions.
### Key Observations
1. **Symmetry**: The pyramid is geometrically regular, with equal angles at the apex.
2. **Color Gradient**: The blue-to-red transition suggests a parameterized property (e.g., stress magnitude), but no explicit scale or units are provided.
3. **Missing Legends**: No explicit explanation of edge colors or gradient meaning is present.
4. **Perspective**: The pyramid is viewed from a slightly elevated angle, emphasizing the front and right faces.
### Interpretation
This diagram likely represents a conceptual model for a geometric or physical system. The color gradient and edge labels may encode relationships between vertices (e.g., forces, connectivity, or state transitions). However, the absence of numerical data or legends limits quantitative analysis. The structure could relate to:
- **Mathematical frameworks**: Binary states ([00], [01], etc.) might represent binary variables or coordinates in a 2D/3D space.
- **Engineering applications**: The pyramid could model stress distribution, with colors indicating magnitude (blue = low, red = high).
- **Network topology**: Vertices as nodes and edges as connections, with colors denoting link types or capacities.
**Critical Uncertainties**:
- The exact meaning of the color gradient and edge labels remains ambiguous without additional context.
- No numerical values or scales are provided, making precise interpretation speculative.
**Note**: The image contains no textual data beyond vertex labels and color coding. All interpretations are based on visual structure and common conventions in technical diagrams.