## 3D Diagram: Tetrahedral Representation of Quantum States
### Overview
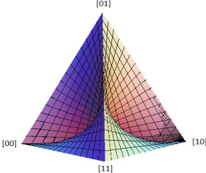
The image is a 3D diagram depicting a tetrahedron, with each vertex labeled with a quantum state: |00>, |01>, |10>, and |11>. The surfaces of the tetrahedron are curved and colored, representing the distribution or relationship between these quantum states. The diagram appears to illustrate a concept related to quantum information or quantum computing.
### Components/Axes
* **Vertices:**
* Top: |01>
* Left: |00>
* Right: |10>
* Bottom: |11>
* **Surfaces:** The surfaces are curved and colored, with a grid overlay. The colors vary across the surfaces, suggesting different regions or properties.
### Detailed Analysis
The tetrahedron is oriented with the |01> state at the top, |00> to the left, |10> to the right, and |11> at the bottom. The surfaces connecting these vertices are curved inward. The surface connecting |00>, |01>, and |11> is primarily blue. The surface connecting |01>, |10>, and |11> is primarily orange/peach. The surface connecting |00>, |10>, and |11> is a mix of light blue and peach.
### Key Observations
The curvature of the surfaces and the color gradients suggest a complex relationship between the quantum states represented at the vertices. The grid overlay helps visualize the shape and curvature of the surfaces.
### Interpretation
This diagram likely represents a visualization of the state space for a two-qubit system. The vertices represent the four basis states, and the surfaces represent superpositions of these states. The curvature and coloring might indicate the entanglement or other properties of these superpositions. The diagram is a geometric representation of the abstract mathematical space of quantum states, providing a visual aid for understanding their relationships.