\n
## Document: Financial Statement Extract & Reasoning
### Overview
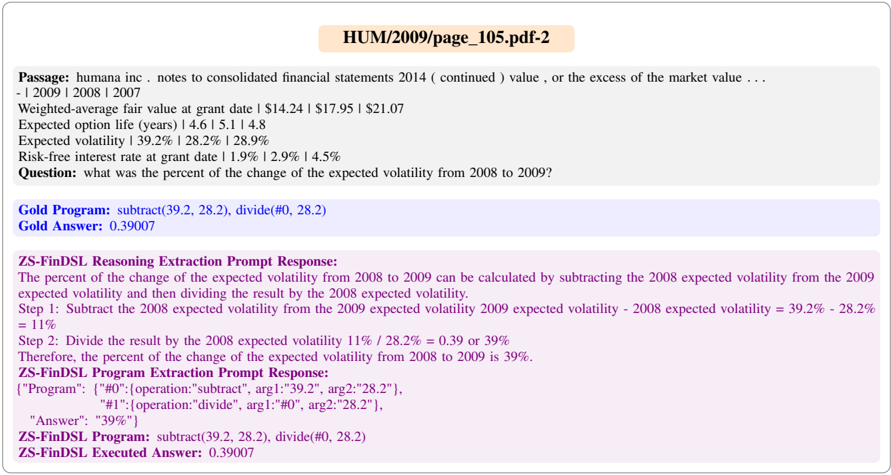
This document appears to be an extract from a financial statement (HUM/2009/page_105.pdf-2) alongside a question, a "Gold Program" solution, and a reasoning explanation generated by a "ZS-FinDSL" system. The document focuses on calculating the percentage change in expected volatility from 2008 to 2009.
### Components/Axes
The document is structured into several sections:
1. **Passage:** Contains financial data related to "humana inc. notes to consolidated financial statements 2014 (continued) value, or the excess of the market value..." with years 2009, 2008, and 2007.
2. **Data Points:** Specific values are listed for:
* Weighted-average fair value at grant date: $14.24 | $17.95 | $21.07
* Expected option life (years): 4.6 | 5.1 | 4.8
* Expected volatility: 39.2% | 28.2% | 28.9%
* Risk-free interest rate at grant date: 1.9% | 2.9% | 4.5%
3. **Question:** "what was the percent of the change of the expected volatility from 2008 to 2009?"
4. **Gold Program:** `subtract(39.2, 28.2), divide(#0, 28.2)`
5. **Gold Answer:** 0.39007
6. **ZS-FinDSL Reasoning Extraction Prompt Response:** A step-by-step explanation of the calculation.
7. **ZS-FinDSL Program Extraction Prompt Response:** A structured representation of the program: `{"Program": [...], "Answer": "39%"}`
8. **ZS-FinDSL Program:** `subtract(39.2, 28.2), divide(#0, 28.2)`
9. **ZS-FinDSL Executed Answer:** 0.39007
### Detailed Analysis or Content Details
Let's break down the data and calculations:
* **Weighted-average fair value at grant date:**
* 2009: $14.24
* 2008: $17.95
* 2007: $21.07
* **Expected option life (years):**
* 2009: 4.6 years
* 2008: 5.1 years
* 2007: 4.8 years
* **Expected volatility:**
* 2009: 39.2%
* 2008: 28.2%
* 2007: 28.9%
* **Risk-free interest rate at grant date:**
* 2009: 1.9%
* 2008: 2.9%
* 2007: 4.5%
The question asks for the percentage change in expected volatility from 2008 to 2009. The "Gold Program" calculates this as follows:
1. Subtract the 2008 expected volatility (28.2%) from the 2009 expected volatility (39.2%): 39.2% - 28.2% = 11%
2. Divide the result (11%) by the 2008 expected volatility (28.2%): 11% / 28.2% = 0.39007 (approximately)
The "Gold Answer" is given as 0.39007. The ZS-FinDSL system provides both a textual explanation and a structured program representation. The final answer from the ZS-FinDSL system is also 0.39007, and the textual answer is 39%.
### Key Observations
* The expected volatility increased significantly from 2008 (28.2%) to 2009 (39.2%).
* The ZS-FinDSL system correctly calculates the percentage change in expected volatility.
* There is a slight discrepancy between the "Gold Answer" (0.39007) and the ZS-FinDSL textual answer (39%), likely due to rounding.
### Interpretation
This document demonstrates a financial calculation related to option pricing. The expected volatility is a key input in option pricing models (like Black-Scholes). The calculation presented aims to quantify the change in this volatility over time. The use of a "Gold Program" and a "ZS-FinDSL" system suggests an automated approach to financial analysis and risk management. The system is capable of both performing the calculation and providing a human-readable explanation of the process. The increase in expected volatility from 2008 to 2009 could indicate increased market uncertainty or risk during that period. The fact that the system provides both a decimal and percentage representation of the result suggests a focus on both precision and interpretability.