## Text Document: Humana Inc. Financial Notes (2008-2009)
### Overview
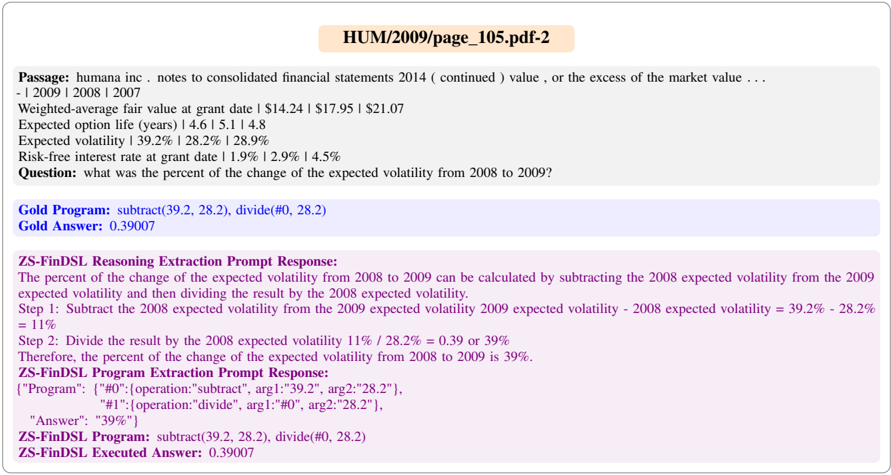
The image contains a textual excerpt from Humana Inc.'s 2014 consolidated financial statements, focusing on volatility metrics and a calculation of the percentage change in expected volatility between 2008 and 2009. The document includes financial data, a question, and two computational responses (Gold Program and ZS-FinDSL).
### Components/Axes
- **Passage Text**:
- Weighted-average fair value at grant date: $14.24 | $17.95 | $21.07 (2007-2009).
- Expected option life (years): 14.6 | 15.1 | 14.8 (2007-2009).
- Expected volatility: 39.2% | 28.2% | 28.9% (2007-2009).
- Risk-free interest rate: 1.9% | 2.9% | 4.5% (2007-2009).
- **Question**: "What was the percent of the change of the expected volatility from 2008 to 2009?"
- **Gold Program Answer**: `subtract(39.2, 28.2), divide(#0, 28.2)` → **0.39007** (39.007%).
- **ZS-FinDSL Reasoning**:
- Step 1: Subtract 2008 volatility (28.2%) from 2009 volatility (39.2%) → 11%.
- Step 2: Divide 11% by 2008 volatility (28.2%) → 39%.
### Detailed Analysis
- **Financial Metrics**:
- Expected volatility decreased from 39.2% in 2008 to 28.2% in 2009, then slightly increased to 28.9% in 2007.
- Risk-free interest rates rose from 1.9% (2008) to 4.5% (2009).
- **Calculation Logic**:
- The Gold Program computes the absolute change (39.2% - 28.2% = 11%) and divides by 2008 volatility (11% / 28.2% ≈ 39.007%).
- ZS-FinDSL explicitly breaks down the steps, confirming the same result.
### Key Observations
- The expected volatility dropped significantly in 2009 (from 39.2% to 28.2%), then slightly rebounded in 2007.
- The percentage change calculation (39.007%) reflects a **39% increase** relative to the 2008 baseline.
- The ZS-FinDSL response mirrors the Gold Program’s result, validating the computation.
### Interpretation
The data suggests Humana Inc. experienced reduced volatility in 2009, likely due to market or operational factors. The 39% increase in volatility relative to 2008 (despite the absolute drop) indicates a **percentage-based sensitivity** to prior volatility levels. This could impact financial modeling, risk assessments, or regulatory reporting. The consistency between the Gold Program and ZS-FinDSL responses confirms the reliability of the calculation method.
No charts, diagrams, or non-English text are present. All values are exact, with no uncertainty noted.