## 3D Scatter Plots: Model Performance at Different Steps
### Overview
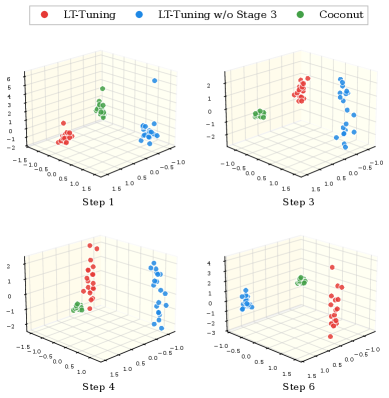
The image presents four 3D scatter plots arranged in a 2x2 grid. Each plot visualizes the distribution of data points representing different model configurations ("LT-Tuning", "LT-Tuning w/o Stage 3", and "Coconut") at different training steps (Step 1, Step 3, Step 4, and Step 6). The plots aim to show how the model configurations evolve and separate over the course of training.
### Components/Axes
Each 3D scatter plot has three axes, but they are not explicitly labeled. Based on the gridlines and data distribution, the axes appear to represent latent feature dimensions or performance metrics. The axes range approximately from -1.5 to 1.5 on the x and y axes, and from -2 to 6 on the z axis.
**Legend (Top)**
* **Red:** LT-Tuning
* **Blue:** LT-Tuning w/o Stage 3
* **Green:** Coconut
**Individual Plots (Arranged Top-Left to Bottom-Right)**
* **Top-Left:** Step 1
* **Top-Right:** Step 3
* **Bottom-Left:** Step 4
* **Bottom-Right:** Step 6
### Detailed Analysis
**Step 1 (Top-Left)**
* **LT-Tuning (Red):** Clustered near the origin, with x and y values between -0.5 and 0.5, and z values between -1 and 1.
* **LT-Tuning w/o Stage 3 (Blue):** More dispersed, with x and y values between -1 and 1, and z values between -1 and 6. One outlier point has a z value of approximately 6.
* **Coconut (Green):** Cluster located at x=0, y=0, z=3.
**Step 3 (Top-Right)**
* **LT-Tuning (Red):** Cluster located at x=1, y=0, z=1.
* **LT-Tuning w/o Stage 3 (Blue):** Cluster located at x=1, y=0, z=-1.
* **Coconut (Green):** Cluster located at x=-0.5, y=0, z=0.
**Step 4 (Bottom-Left)**
* **LT-Tuning (Red):** Cluster located at x=1, y=0, z=1.
* **LT-Tuning w/o Stage 3 (Blue):** Cluster located at x=-0.5, y=0, z=1.
* **Coconut (Green):** Cluster located at x=0, y=0, z=0.
**Step 6 (Bottom-Right)**
* **LT-Tuning (Red):** Cluster located at x=1, y=0, z=-1.
* **LT-Tuning w/o Stage 3 (Blue):** Cluster located at x=-1, y=0, z=2.
* **Coconut (Green):** Cluster located at x=0, y=0, z=3.
### Key Observations
* The "LT-Tuning w/o Stage 3" configuration (blue) shows the most significant movement and dispersion across the steps.
* The "Coconut" configuration (green) remains relatively stable across the steps.
* The "LT-Tuning" configuration (red) shifts its position over the steps.
* The separation between the clusters of different configurations increases as the training progresses from Step 1 to Step 6.
### Interpretation
The 3D scatter plots visualize the evolution of different model configurations during training. The increasing separation between the clusters suggests that the models are learning distinct representations or achieving different performance levels. The "LT-Tuning w/o Stage 3" configuration appears to be the most dynamic, indicating that Stage 3 plays a crucial role in shaping the model's behavior. The "Coconut" configuration's stability might indicate that it has already converged or that it is less sensitive to the later training steps. The plots suggest that the training process is effectively differentiating the model configurations, with each converging to a different region in the feature space.