\n
## 3D Scatter Plots: LT-Tuning Performance Over Steps
### Overview
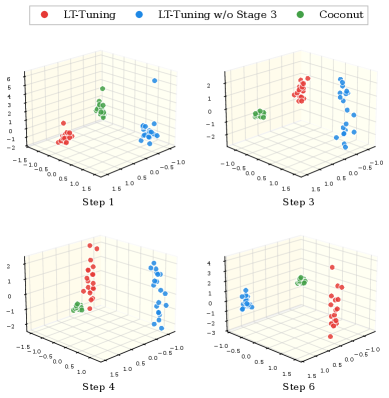
The image presents four 3D scatter plots, each representing a different step in a training or evaluation process. The plots visualize the distribution of data points for three different methods: "LT-Tuning" (red), "LT-Tuning w/o Stage 3" (blue), and "Coconut" (green). The axes are not explicitly labeled, but appear to represent three dimensions of some embedding space, ranging approximately from -10 to 10. Each plot is labeled with a "Step" number: 1, 3, 4, and 6.
### Components/Axes
* **X-axis:** Ranges approximately from -10 to 10.
* **Y-axis:** Ranges approximately from -10 to 10.
* **Z-axis:** Ranges approximately from -10 to 4.
* **Legend:** Located in the top-left corner of the image.
* Red: LT-Tuning
* Blue: LT-Tuning w/o Stage 3
* Green: Coconut
* **Step Labels:** Located at the bottom-left of each plot: "Step 1", "Step 3", "Step 4", "Step 6".
### Detailed Analysis or Content Details
**Step 1:**
* **LT-Tuning (Red):** Approximately 6 data points. The points are clustered in the negative X and Y quadrants, with Z values ranging from -1 to 0.5.
* **LT-Tuning w/o Stage 3 (Blue):** Approximately 10 data points. These points are more dispersed, extending further into the positive X and Y quadrants, with Z values ranging from 0 to 2.
* **Coconut (Green):** Approximately 5 data points. These points are clustered near the origin, with Z values ranging from -0.5 to 0.5.
**Step 3:**
* **LT-Tuning (Red):** Approximately 12 data points. The points are more spread out than in Step 1, with some extending into the positive X and Y quadrants. Z values range from -1 to 2.
* **LT-Tuning w/o Stage 3 (Blue):** Approximately 10 data points. These points are clustered in the positive X and Y quadrants, with Z values ranging from 0 to 2.
* **Coconut (Green):** Approximately 5 data points. These points remain clustered near the origin, similar to Step 1.
**Step 4:**
* **LT-Tuning (Red):** Approximately 10 data points. The points are clustered in the positive X and Y quadrants, with Z values ranging from 0 to 2.
* **LT-Tuning w/o Stage 3 (Blue):** Approximately 10 data points. These points are clustered in the positive X and Y quadrants, with Z values ranging from 0 to 2.
* **Coconut (Green):** Approximately 5 data points. These points remain clustered near the origin, similar to Step 1 and Step 3.
**Step 6:**
* **LT-Tuning (Red):** Approximately 8 data points. The points are clustered in the negative X and Y quadrants, with Z values ranging from -1 to 1.
* **LT-Tuning w/o Stage 3 (Blue):** Approximately 10 data points. These points are clustered in the positive X and Y quadrants, with Z values ranging from 0 to 2.
* **Coconut (Green):** Approximately 5 data points. These points remain clustered near the origin, similar to previous steps.
### Key Observations
* The "Coconut" method consistently remains clustered near the origin across all steps.
* "LT-Tuning" and "LT-Tuning w/o Stage 3" exhibit more dynamic movement across the steps.
* "LT-Tuning w/o Stage 3" generally occupies the positive X and Y quadrants, while "LT-Tuning" shifts between negative and positive quadrants over the steps.
* The distribution of "LT-Tuning" appears to change significantly between Step 1 and Step 6, suggesting a shift in its embedding space representation.
### Interpretation
The plots likely represent the embedding of data points after each step of a training process. The different methods ("LT-Tuning", "LT-Tuning w/o Stage 3", and "Coconut") are being evaluated based on their position in this embedding space.
The consistent clustering of "Coconut" near the origin suggests it may be less effective at separating or distinguishing data points compared to the "LT-Tuning" methods. The movement of "LT-Tuning" and "LT-Tuning w/o Stage 3" indicates that these methods are actively learning and adjusting their representations over the steps.
The shift in "LT-Tuning" from negative to positive quadrants (and back) between Step 1 and Step 6 could indicate a complex learning trajectory, potentially involving exploration of different feature spaces or optimization landscapes. The fact that "LT-Tuning w/o Stage 3" remains consistently in the positive quadrants suggests that Stage 3 of the "LT-Tuning" process plays a crucial role in shaping the embedding space and potentially avoiding local optima.
The lack of explicit axis labels makes it difficult to interpret the meaning of the X, Y, and Z dimensions. However, the relative positions of the data points provide valuable insights into the performance and behavior of the different methods.