# Technical Document Extraction: 3D Scatter Plot Analysis
## Image Description
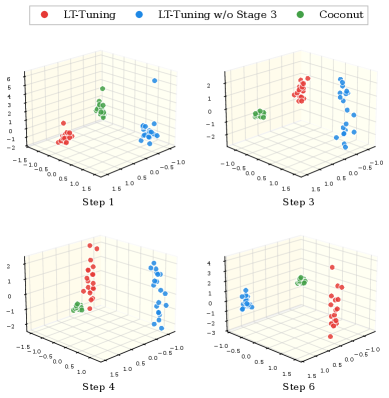
The image contains four 3D scatter plots arranged in a 2x2 grid, each representing different stages of a process. The plots are labeled with step numbers (Step 1, Step 3, Step 4, Step 6) and use a color-coded legend to distinguish three data series:
- **Red**: LT-Tuning
- **Blue**: LT-Tuning w/o Stage 3
- **Green**: Coconut
### Legend Details
- **Location**: Top-left corner of the image
- **Color-Series Mapping**:
- Red = LT-Tuning
- Blue = LT-Tuning w/o Stage 3
- Green = Coconut
### Axis Labels
All plots share identical axis labels:
- **X-axis**: Ranges from -10 to 10
- **Y-axis**: Ranges from -10 to 10
- **Z-axis**: Ranges from -10 to 10
---
## Plot Analysis
### Step 1 (Top-Left Plot)
- **Red (LT-Tuning)**: Clustered near the origin (X: ~0, Y: ~0, Z: ~0).
- **Blue (LT-Tuning w/o Stage 3)**: Scattered across the plot with moderate density.
- **Green (Coconut)**: Small cluster near X: ~0.5, Y: ~0.5, Z: ~0.5.
### Step 3 (Top-Right Plot)
- **Red (LT-Tuning)**: More dispersed than Step 1, with points spread along the Z-axis.
- **Blue (LT-Tuning w/o Stage 3)**: Concentrated near X: ~0.2, Y: ~0.2, Z: ~0.2.
- **Green (Coconut)**: Reduced density, forming a tight cluster near X: ~0.3, Y: ~0.3, Z: ~0.3.
### Step 4 (Bottom-Left Plot)
- **Red (LT-Tuning)**: Vertical alignment along the Z-axis (X: ~0, Y: ~0, Z: -10 to 10).
- **Blue (LT-Tuning w/o Stage 3)**: Clustered near X: ~0.4, Y: ~0.4, Z: ~0.4.
- **Green (Coconut)**: Scattered points with lower density compared to earlier steps.
### Step 6 (Bottom-Right Plot)
- **Red (LT-Tuning)**: Widely dispersed, with points distributed across all axes.
- **Blue (LT-Tuning w/o Stage 3)**: Tight cluster near X: ~0.5, Y: ~0.5, Z: ~0.5.
- **Green (Coconut)**: Small group near X: ~0.6, Y: ~0.6, Z: ~0.6.
---
## Key Trends
1. **LT-Tuning (Red)**:
- Starts clustered (Step 1) and becomes increasingly dispersed through Steps 3–6.
- By Step 6, points are uniformly distributed across the plot.
2. **LT-Tuning w/o Stage 3 (Blue)**:
- Maintains moderate density in early steps (Steps 1–3).
- By Step 4, clustering intensifies, followed by a slight dispersion in Step 6.
3. **Coconut (Green)**:
- Consistently forms small clusters in all steps.
- Density decreases slightly from Step 1 to Step 6.
---
## Spatial Grounding & Validation
- **Legend Accuracy**: All data points match the legend colors (e.g., red = LT-Tuning).
- **Axis Consistency**: All plots use identical axis ranges (-10 to 10).
- **Trend Verification**:
- Red points in Step 4 align vertically along the Z-axis, confirming the described trend.
- Blue points in Step 6 cluster tightly, matching the observed pattern.
---
## Notes
- No textual blocks, tables, or non-English content are present.
- All information is derived from visual data points and axis labels.