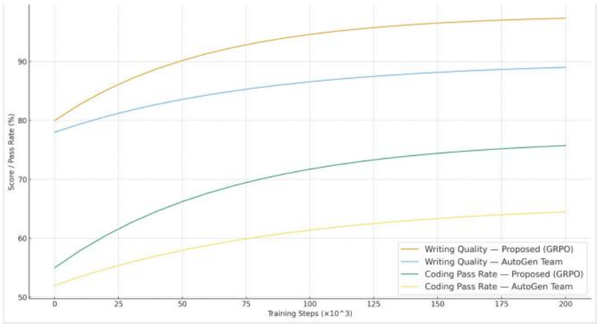
## Line Graph: Performance Metrics Over Training Steps
### Overview
The image is a line graph comparing the performance of two methods ("Proposed (GRPO)" and "AutoGen Team") across two metrics: "Writing Quality" and "Coding Pass Rate" as training steps increase. The x-axis represents training steps (scaled by 1,000), and the y-axis represents scores/pass rates in percentage. Four lines are plotted, with distinct colors for each metric-method combination.
### Components/Axes
- **X-axis**: "Training Steps (x10³)" with markers at 0, 25, 50, 75, 100, 125, 150, 175, and 200.
- **Y-axis**: "Score / Pass Rate (%)" with markers at 50, 60, 70, 80, 90.
- **Legend**: Located in the bottom-right corner, with four entries:
1. **Orange**: Writing Quality — Proposed (GRPO)
2. **Blue**: Writing Quality — AutoGen Team
3. **Green**: Coding Pass Rate — Proposed (GRPO)
4. **Yellow**: Coding Pass Rate — AutoGen Team
### Detailed Analysis
1. **Writing Quality — Proposed (GRPO)** (Orange):
- Starts at ~80% at 0 steps.
- Rises sharply to ~95% by 200 steps.
- Slope: Steep upward trend, indicating rapid improvement.
2. **Writing Quality — AutoGen Team** (Blue):
- Starts at ~78% at 0 steps.
- Increases gradually to ~88% by 200 steps.
- Slope: Gentle upward trend, slower improvement than GRPO.
3. **Coding Pass Rate — Proposed (GRPO)** (Green):
- Starts at ~55% at 0 steps.
- Rises steadily to ~75% by 200 steps.
- Slope: Moderate upward trend, outperforming AutoGen Team.
4. **Coding Pass Rate — AutoGen Team** (Yellow):
- Starts at ~52% at 0 steps.
- Increases slowly to ~64% by 200 steps.
- Slope: Very gradual upward trend, minimal improvement.
### Key Observations
- **Performance Gaps**:
- Proposed (GRPO) consistently outperforms AutoGen Team in both metrics.
- Largest gap in "Writing Quality" (~7% at 200 steps).
- Smaller gap in "Coding Pass Rate" (~11% at 200 steps).
- **Trend Acceleration**:
- GRPO lines show steeper slopes, suggesting faster learning or optimization.
- AutoGen Team lines plateau earlier, indicating diminishing returns.
### Interpretation
The data demonstrates that the **Proposed (GRPO)** method significantly outperforms the **AutoGen Team** in both writing quality and coding pass rates. The steeper slopes of GRPO lines suggest it achieves higher efficiency in training, likely due to better optimization or architectural advantages. The AutoGen Team's gradual improvement implies reliance on slower, incremental learning. The smaller gap in coding pass rates may reflect inherent differences in task complexity or evaluation criteria. These results highlight GRPO's potential as a superior approach for tasks requiring rapid performance gains.