\n
## Line Chart: Performance Comparison of Proposed (GRPO) and AutoGen Team
### Overview
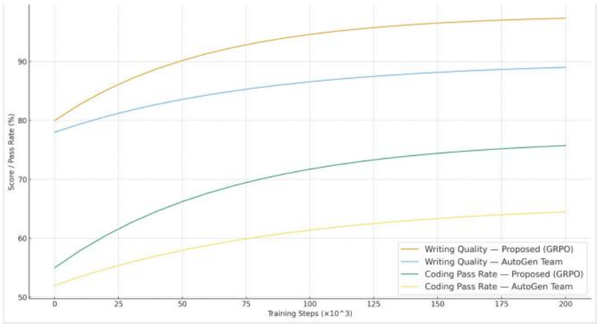
This line chart compares the performance of a "Proposed (GRPO)" method against an "AutoGen Team" method across two metrics: "Writing Quality" and "Coding Pass Rate". Performance is measured as a percentage ("Score / Pass Rate (%)") over "Training Steps" (expressed as multiples of 10^3).
### Components/Axes
* **X-axis:** Training Steps (x10^3), ranging from 0 to 200, with tick marks at 0, 25, 50, 75, 100, 125, 150, and 200.
* **Y-axis:** Score / Pass Rate (%), ranging from 50% to 90%, with tick marks at 50, 60, 70, 80, and 90.
* **Legend:** Located in the bottom-right corner. Contains the following entries:
* Yellow Line: "Writing Quality – Proposed (GRPO)"
* Blue Line: "Writing Quality – AutoGen Team"
* Light Green Line: "Coding Pass Rate – Proposed (GRPO)"
* Light Blue Line: "Coding Pass Rate – AutoGen Team"
### Detailed Analysis
**Writing Quality – Proposed (GRPO) (Yellow Line):**
The yellow line shows an upward trend, starting at approximately 68% at 0 training steps. It increases rapidly initially, then plateaus.
* At 25 training steps: ~75%
* At 50 training steps: ~82%
* At 75 training steps: ~87%
* At 100 training steps: ~89%
* At 125 training steps: ~90%
* At 150 training steps: ~91%
* At 200 training steps: ~91%
**Writing Quality – AutoGen Team (Blue Line):**
The blue line also shows an upward trend, but it is less steep than the yellow line. It starts at approximately 62% at 0 training steps.
* At 25 training steps: ~66%
* At 50 training steps: ~72%
* At 75 training steps: ~76%
* At 100 training steps: ~78%
* At 125 training steps: ~80%
* At 150 training steps: ~82%
* At 200 training steps: ~84%
**Coding Pass Rate – Proposed (GRPO) (Light Green Line):**
The light green line shows a significant upward trend, starting at approximately 58% at 0 training steps. It increases rapidly and then begins to level off.
* At 25 training steps: ~64%
* At 50 training steps: ~72%
* At 75 training steps: ~78%
* At 100 training steps: ~82%
* At 125 training steps: ~85%
* At 150 training steps: ~87%
* At 200 training steps: ~88%
**Coding Pass Rate – AutoGen Team (Light Blue Line):**
The light blue line shows an upward trend, but it is less pronounced than the light green line. It starts at approximately 55% at 0 training steps.
* At 25 training steps: ~59%
* At 50 training steps: ~65%
* At 75 training steps: ~70%
* At 100 training steps: ~74%
* At 125 training steps: ~76%
* At 150 training steps: ~78%
* At 200 training steps: ~80%
### Key Observations
* The "Proposed (GRPO)" method consistently outperforms the "AutoGen Team" method for both "Writing Quality" and "Coding Pass Rate".
* The "Coding Pass Rate" shows a larger performance gap between the two methods than "Writing Quality".
* Both metrics exhibit diminishing returns with increasing training steps, indicating that the performance gains start to plateau after a certain point.
* The "Proposed (GRPO)" method reaches a higher plateau for both metrics.
### Interpretation
The data suggests that the "Proposed (GRPO)" method is more effective than the "AutoGen Team" method in both writing quality and coding pass rate. The larger performance difference in coding pass rate indicates that the "Proposed (GRPO)" method may be particularly beneficial for tasks requiring higher accuracy and reliability. The diminishing returns observed with increasing training steps suggest that there is an optimal training duration beyond which further training does not significantly improve performance. This could be due to the model reaching its capacity or the training data becoming saturated. The chart provides a quantitative comparison of the two methods, allowing for informed decision-making regarding which method to employ based on the specific requirements of the task. The consistent outperformance of the "Proposed (GRPO)" method suggests a superior underlying algorithm or training strategy.