# Technical Document Extraction: INT3/g128 Performance Analysis
## Chart Overview
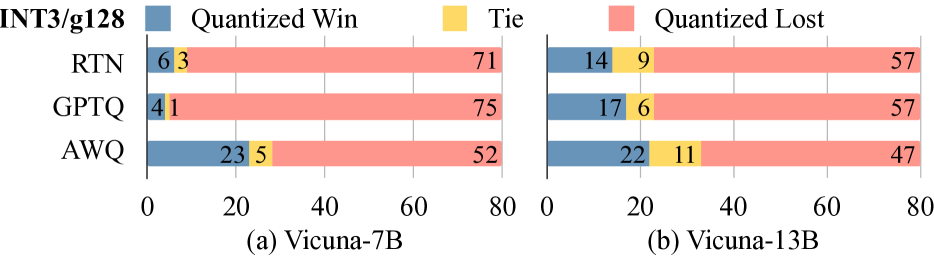
The image presents a comparative bar chart analyzing the performance of three quantization methods (RTN, GPTQ, AWQ) across two Vicuna model sizes (7B and 13B). The chart uses color-coded bars to represent three performance categories: Quantized Win (blue), Tie (yellow), and Quantized Lost (red).
---
### Legend & Axis Labels
- **Legend**: Located on the right side of the chart
- Blue: Quantized Win
- Yellow: Tie
- Red: Quantized Lost
- **X-axis**: Numerical scale from 0 to 80 (performance metric)
- **Y-axis**: Model configurations
- Sub-chart (a): Vicuna-7B
- Sub-chart (b): Vicuna-13B
---
### Data Extraction
#### Sub-chart (a): Vicuna-7B
| Model | Quantized Win | Tie | Quantized Lost |
|-------|---------------|-----|----------------|
| RTN | 6 | 3 | 71 |
| GPTQ | 4 | 1 | 75 |
| AWQ | 23 | 5 | 52 |
#### Sub-chart (b): Vicuna-13B
| Model | Quantized Win | Tie | Quantized Lost |
|-------|---------------|-----|----------------|
| RTN | 14 | 9 | 57 |
| GPTQ | 17 | 6 | 57 |
| AWQ | 22 | 11 | 47 |
---
### Spatial Grounding & Color Verification
1. **Legend Position**: Right-aligned, adjacent to both sub-charts
2. **Color Consistency**:
- All blue bars correspond to "Quantized Win" values
- Yellow bars match "Tie" metrics
- Red bars represent "Quantized Lost" outcomes
3. **Axis Alignment**:
- X-axis values increase left-to-right (0-80)
- Y-axis models are vertically stacked per sub-chart
---
### Trend Verification
1. **Vicuna-7B (Sub-chart a)**:
- RTN shows the highest Quantized Lost (71)
- AWQ demonstrates the strongest Quantized Win performance (23)
- GPTQ has the lowest Quantized Win (4) and highest Tie (1)
2. **Vicuna-13B (Sub-chart b)**:
- AWQ maintains lead in Quantized Wins (22)
- RTN and GPTQ show identical Quantized Lost counts (57)
- Tie values increase across all models from 7B to 13B versions
---
### Component Isolation
1. **Header**: "INT3/g128" title at top-center
2. **Main Chart**:
- Two vertically stacked sub-charts (a/b)
- Each sub-chart contains three grouped bars per model
3. **Footer**: X-axis labels and numerical scale
---
### Data Table Reconstruction
| Model | Vicuna-7B: Quantized Win | Vicuna-7B: Tie | Vicuna-7B: Quantized Lost | Vicuna-13B: Quantized Win | Vicuna-13B: Tie | Vicuna-13B: Quantized Lost |
|-------|--------------------------|----------------|---------------------------|---------------------------|-----------------|----------------------------|
| RTN | 6 | 3 | 71 | 14 | 9 | 57 |
| GPTQ | 4 | 1 | 75 | 17 | 6 | 57 |
| AWQ | 23 | 5 | 52 | 22 | 11 | 47 |
---
### Critical Observations
1. **Performance Scaling**:
- Quantized Win values increase by 2-3x when moving from 7B to 13B models
- Tie values show proportional growth (e.g., RTN: 3→9, GPTQ: 1→6)
2. **Quantized Lost Trends**:
- RTN maintains highest loss rates in both configurations
- AWQ demonstrates most significant improvement in 13B version (52→47)
3. **Color-Coded Validation**:
- All red bars (Quantized Lost) exceed 47 in both sub-charts
- Yellow bars (Tie) never exceed 11 in either configuration