## Bar Chart: Mean Values Across Layers
### Overview
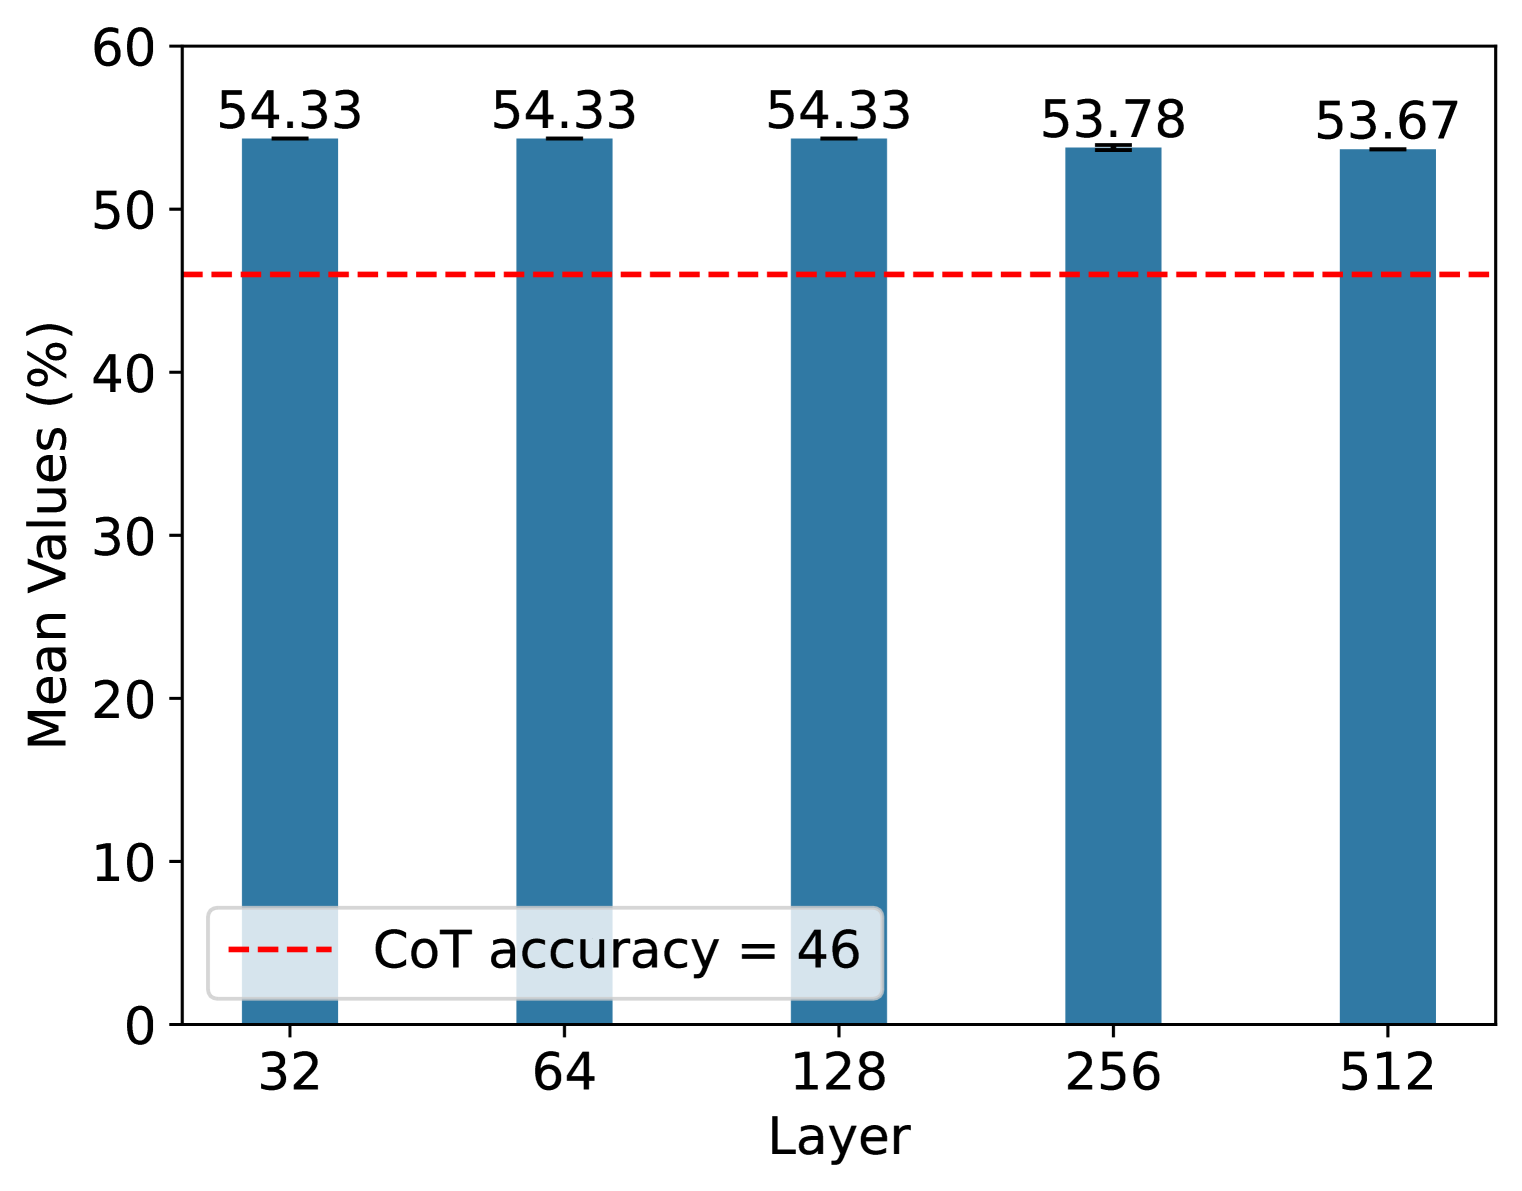
The chart displays a bar graph comparing mean values (in percentage) across five distinct layers (32, 64, 128, 256, 512). A red dashed reference line at 46% is labeled as "CoT accuracy = 46" in a light blue box at the bottom left. All bars exceed this threshold, with values ranging from 53.67% to 54.33%.
### Components/Axes
- **X-axis (Layer)**: Discrete categories labeled 32, 64, 128, 256, 512.
- **Y-axis (Mean Values %)**: Continuous scale from 0 to 60, with increments of 10.
- **Legend**: Positioned at the bottom left, enclosed in a light blue box. Text reads "CoT accuracy = 46" with a red dashed line matching the reference line.
- **Bars**: Blue vertical bars for each layer, annotated with exact percentage values.
### Detailed Analysis
- **Layer 32**: 54.33% (tallest bar).
- **Layer 64**: 54.33% (identical to Layer 32).
- **Layer 128**: 54.33% (identical to Layers 32 and 64).
- **Layer 256**: 53.78% (slight decrease from previous layers).
- **Layer 512**: 53.67% (smallest value, marginally lower than Layer 256).
### Key Observations
1. **Consistency**: The first three layers (32, 64, 128) share identical mean values (54.33%).
2. **Gradual Decline**: A minor but consistent drop occurs in Layers 256 (53.78%) and 512 (53.67%).
3. **Reference Line**: All bars exceed the CoT accuracy threshold (46%), suggesting the model’s performance remains above this baseline across all layers.
### Interpretation
The data indicates that mean values are relatively stable across smaller layers (32–128) but exhibit a slight decline as layer size increases (256–512). The CoT accuracy (46%) serves as a benchmark, with all layers performing significantly better. This could imply that larger layers may introduce minor inefficiencies or variability, though the overall performance remains robust. The uniformity in the first three layers suggests optimal scaling up to 128, after which performance begins to taper off marginally.