## Diagram: Directed Acyclic Graph (DAG) Comparison
### Overview
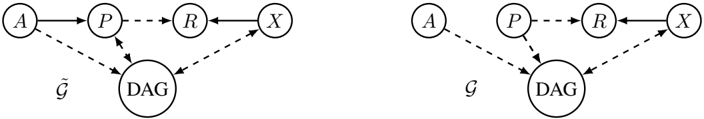
The image depicts two directed acyclic graph (DAG) structures labeled **G** (left) and **Ĝ** (right). Both diagrams share nodes **A**, **P**, **R**, **X**, and a central **DAG** node. Arrows indicate directional relationships, with solid lines representing direct connections and dashed lines suggesting indirect or probabilistic relationships.
### Components/Axes
- **Nodes**:
- **A**, **P**, **R**, **X**: Terminal nodes.
- **DAG**: Central node acting as a hub.
- **Arrows**:
- **Solid arrows**: Direct dependencies (e.g., A → P, P → R, R → X).
- **Dashed arrows**: Indirect or hypothesized relationships (e.g., A → DAG, P → DAG, R → DAG, DAG → X).
- **Labels**:
- **G** (left diagram) and **Ĝ** (right diagram) denote two distinct graph configurations.
### Detailed Analysis
1. **Solid Arrows (Direct Connections)**:
- Both diagrams share the chain **A → P → R → X**, forming a linear dependency path.
2. **Dashed Arrows (Indirect Relationships)**:
- **Left Diagram (Ĝ)**:
- **A**, **P**, and **R** have dashed arrows pointing to **DAG**, suggesting feedback or influence from these nodes to the central hub.
- **DAG** has a dashed arrow pointing to **X**, implying a potential indirect effect on **X**.
- **Right Diagram (G)**:
- Only **P** and **R** have dashed arrows to **DAG**, with no connection from **DAG** to **X**.
3. **Structural Differences**:
- **Ĝ** includes additional dashed connections (A → DAG, DAG → X) compared to **G**, indicating expanded dependencies or feedback loops.
### Key Observations
- **Ĝ** introduces more bidirectional relationships (e.g., A → DAG and DAG → X) absent in **G**.
- The central **DAG** node acts as a mediator in **Ĝ** but not in **G**, where dependencies terminate at **X**.
- Dashed arrows in **Ĝ** suggest uncertainty or alternative pathways not present in **G**.
### Interpretation
This diagram likely compares two graph configurations:
- **G** represents a simplified, linear dependency structure where **X** is solely influenced by **R**.
- **Ĝ** introduces a more complex system where **DAG** mediates relationships, potentially modeling feedback loops or probabilistic influences.
- The absence of a legend implies that arrow styles (solid vs. dashed) are universally understood to denote direct vs. indirect relationships.
- The spatial arrangement (left for **Ĝ**, right for **G**) emphasizes contrast, suggesting **Ĝ** as an evolved or alternative version of **G**.
No numerical data or trends are present; the focus is on structural and relational differences between the two DAGs.