## Diagram: Directed Acyclic Graphs (DAGs)
### Overview
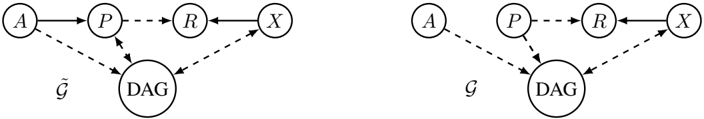
The image presents two directed acyclic graphs (DAGs) illustrating relationships between variables. The left DAG is labeled with a tilde over a 'G', while the right DAG is labeled with a 'G'. The nodes represent variables, and the arrows indicate the direction of influence or dependence. Solid arrows represent direct relationships, while dashed arrows represent indirect or potential relationships.
### Components/Axes
* **Nodes:** Labeled A, P, R, X, and DAG. Each node is enclosed in a circle.
* **Edges:** Solid arrows indicate direct relationships. Dashed arrows indicate indirect or potential relationships.
* **Labels:**
* Left Graph: "~G" (G with a tilde above it)
* Right Graph: "G"
### Detailed Analysis
**Left Graph (~G):**
* A has a solid arrow pointing to P, indicating a direct influence.
* P has dashed arrows pointing to DAG.
* R has a dashed arrow pointing to DAG.
* R has a dashed arrow pointing to X.
* P has a dashed arrow pointing to R.
* X has a dashed arrow pointing to DAG.
* A has a dashed arrow pointing to DAG.
**Right Graph (G):**
* A has a dashed arrow pointing to DAG.
* P has a dashed arrow pointing to DAG.
* R has a solid, bidirectional arrow with X, indicating a direct relationship in both directions.
* X has a dashed arrow pointing to DAG.
### Key Observations
* Both graphs include nodes A, P, R, X, and DAG.
* The primary difference between the two graphs lies in the relationships between the nodes.
* In the left graph, the relationship between R and X is indirect (dashed arrow), while in the right graph, it is direct and bidirectional (solid arrow).
* In the left graph, A has a direct influence on P, while in the right graph, this relationship is absent.
### Interpretation
The diagrams represent two different models of relationships between variables. The left graph (~G) suggests a scenario where A directly influences P, and R and X have an indirect relationship. The right graph (G) suggests a scenario where A's influence on P is removed, and R and X have a direct, bidirectional relationship. The dashed arrows likely represent potential or less certain relationships, while the solid arrows represent more established or direct relationships. The DAG node likely represents a common outcome or dependent variable influenced by the other nodes. The difference between the two graphs could represent different hypotheses or models being compared.