## Sunspot Group and Record Analysis
### Overview
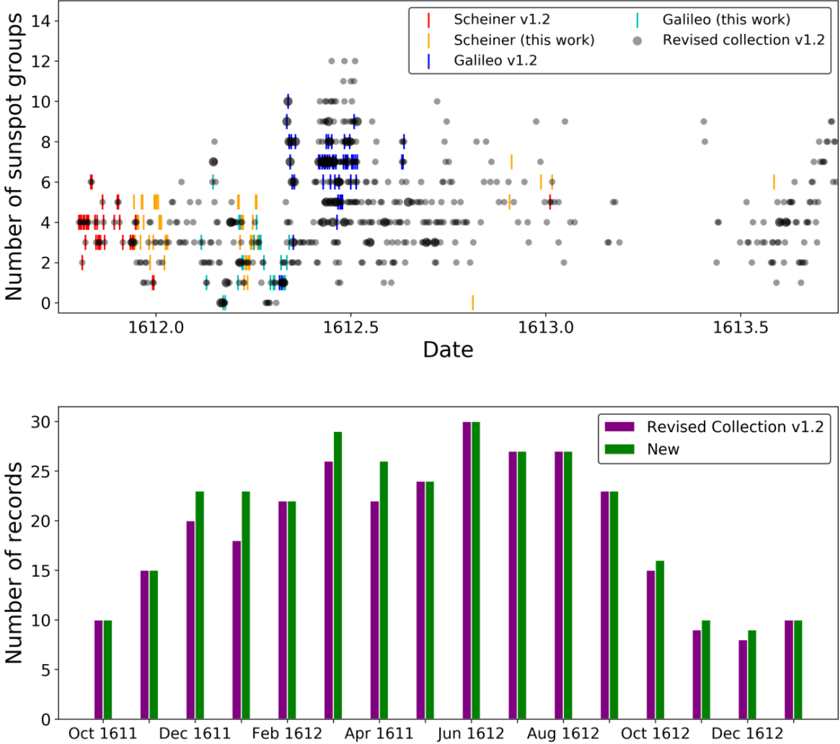
The image presents two charts. The top chart is a scatter plot showing the number of sunspot groups observed over time (1612-1613.5) by different observers (Scheiner, Galileo) and a revised collection. The bottom chart is a bar graph comparing the number of records in the "Revised Collection v1.2" and a "New" dataset across several months from October 1611 to December 1612.
### Components/Axes
**Top Chart (Scatter Plot):**
* **Y-axis:** "Number of sunspot groups", ranging from 0 to 14.
* **X-axis:** "Date", ranging from approximately 1611.8 to 1613.8. Axis markers are present at 1612.0, 1612.5, 1613.0, and 1613.5.
* **Legend (Top-Right):**
* Red: Scheiner v1.2
* Orange: Scheiner (this work)
* Blue: Galileo v1.2
* Teal: Galileo (this work)
* Gray: Revised collection v1.2
**Bottom Chart (Bar Graph):**
* **Y-axis:** "Number of records", ranging from 0 to 30. Axis markers are present at intervals of 5.
* **X-axis:** Months from "Oct 1611" to "Dec 1612" in two-month intervals.
* **Legend (Top-Right):**
* Purple: Revised Collection v1.2
* Green: New
### Detailed Analysis
**Top Chart (Scatter Plot):**
* **Scheiner v1.2 (Red):** Data points are clustered around a value of 4 between 1611.8 and 1612.0.
* **Scheiner (this work) (Orange):** Data points are scattered between 1611.8 and 1613.2, mostly between 2 and 6.
* **Galileo v1.2 (Blue):** Data points are clustered around a value of 6 between 1612.3 and 1612.6.
* **Galileo (this work) (Teal):** Data points are scattered between 1611.9 and 1612.6, mostly between 0 and 4.
* **Revised collection v1.2 (Gray):** Data points are scattered throughout the entire date range, with a higher density between 2 and 8 before 1612.7, and then mostly between 0 and 4 after 1613.0.
**Bottom Chart (Bar Graph):**
* **Revised Collection v1.2 (Purple):**
* Oct 1611: ~10
* Dec 1611: ~15
* Feb 1612: ~22
* Apr 1612: ~22
* Jun 1612: ~30
* Aug 1612: ~22
* Oct 1612: ~15
* Dec 1612: ~8
* **New (Green):**
* Oct 1611: ~10
* Dec 1611: ~20
* Feb 1612: ~23
* Apr 1612: ~29
* Jun 1612: ~26
* Aug 1612: ~27
* Oct 1612: ~16
* Dec 1612: ~10
### Key Observations
* The top chart shows a concentration of sunspot group observations by Scheiner and Galileo around 1612.
* The "Revised collection v1.2" data in the top chart is more dispersed across the entire time range.
* In the bottom chart, the "New" dataset generally has a higher number of records than the "Revised Collection v1.2" dataset, especially between December 1611 and August 1612. Both datasets show a decline in the number of records towards the end of 1612.
### Interpretation
The scatter plot suggests that the early observations of sunspot groups were concentrated around the year 1612, with contributions from Scheiner and Galileo. The "Revised collection v1.2" provides a broader temporal context. The bar graph indicates a difference in the number of records between the "Revised Collection v1.2" and a "New" dataset, potentially reflecting changes in data collection or reporting methods over time. The peak in record numbers around June-August 1612 could be related to increased observational efforts or heightened solar activity during that period. The decline in records towards the end of 1612 might indicate a decrease in observational activity or a change in data recording practices.