# Technical Document: Decision Tree Analysis
## 1. Overview
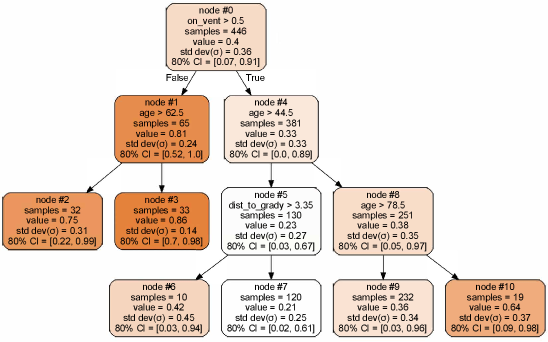
This image displays a **Decision Tree** diagram, likely representing a regression or classification model. The tree consists of 11 nodes (numbered #0 through #10), organized into four hierarchical levels. Each node contains statistical data including sample size, mean value, standard deviation, and an 80% Confidence Interval (CI).
The nodes are color-coded based on their "value" metric:
* **Darker Orange:** Higher values (e.g., Node #3 at 0.86).
* **Light Orange/Peach:** Moderate values (e.g., Node #0 at 0.4).
* **White/Light Grey:** Lower values (e.g., Node #7 at 0.21).
---
## 2. Component Breakdown and Flow
### Level 0: Root Node
* **Node #0**
* **Condition:** `on_vent > 0.5`
* **Samples:** 446
* **Value:** 0.4
* **Std Dev (σ):** 0.36
* **80% CI:** [0.07, 0.91]
* **Flow:** If **False**, proceed to Node #1 (Left). If **True**, proceed to Node #4 (Right).
---
### Level 1: Primary Splits
* **Node #1 (False branch of Node #0)**
* **Condition:** `age > 62.5`
* **Samples:** 65
* **Value:** 0.81
* **Std Dev (σ):** 0.24
* **80% CI:** [0.52, 1.0]
* **Flow:** Splits into Node #2 and Node #3.
* **Node #4 (True branch of Node #0)**
* **Condition:** `age > 44.5`
* **Samples:** 381
* **Value:** 0.33
* **Std Dev (σ):** 0.33
* **80% CI:** [0.0, 0.89]
* **Flow:** Splits into Node #5 and Node #8.
---
### Level 2: Secondary Splits
* **Node #2 (Leaf Node)**
* **Samples:** 32
* **Value:** 0.75
* **Std Dev (σ):** 0.31
* **80% CI:** [0.22, 0.99]
* **Node #3 (Leaf Node)**
* **Samples:** 33
* **Value:** 0.86
* **Std Dev (σ):** 0.14
* **80% CI:** [0.7, 0.98]
* **Node #5**
* **Condition:** `dist_to_grady > 3.35`
* **Samples:** 130
* **Value:** 0.23
* **Std Dev (σ):** 0.27
* **80% CI:** [0.03, 0.67]
* **Flow:** Splits into Node #6 and Node #7.
* **Node #8**
* **Condition:** `age > 78.5`
* **Samples:** 251
* **Value:** 0.38
* **Std Dev (σ):** 0.35
* **80% CI:** [0.05, 0.97]
* **Flow:** Splits into Node #9 and Node #10.
---
### Level 3: Tertiary Leaf Nodes
* **Node #6**
* **Samples:** 10
* **Value:** 0.42
* **Std Dev (σ):** 0.45
* **80% CI:** [0.03, 0.94]
* **Node #7**
* **Samples:** 120
* **Value:** 0.21
* **Std Dev (σ):** 0.25
* **80% CI:** [0.02, 0.61]
* **Node #9**
* **Samples:** 232
* **Value:** 0.36
* **Std Dev (σ):** 0.34
* **80% CI:** [0.03, 0.96]
* **Node #10**
* **Samples:** 19
* **Value:** 0.64
* **Std Dev (σ):** 0.37
* **80% CI:** [0.09, 0.98]
---
## 3. Data Summary Table
| Node ID | Condition | Samples | Value | Std Dev (σ) | 80% CI |
| :--- | :--- | :--- | :--- | :--- | :--- |
| #0 | on_vent > 0.5 | 446 | 0.4 | 0.36 | [0.07, 0.91] |
| #1 | age > 62.5 | 65 | 0.81 | 0.24 | [0.52, 1.0] |
| #2 | (Leaf) | 32 | 0.75 | 0.31 | [0.22, 0.99] |
| #3 | (Leaf) | 33 | 0.86 | 0.14 | [0.7, 0.98] |
| #4 | age > 44.5 | 381 | 0.33 | 0.33 | [0.0, 0.89] |
| #5 | dist_to_grady > 3.35 | 130 | 0.23 | 0.27 | [0.03, 0.67] |
| #6 | (Leaf) | 10 | 0.42 | 0.45 | [0.03, 0.94] |
| #7 | (Leaf) | 120 | 0.21 | 0.25 | [0.02, 0.61] |
| #8 | age > 78.5 | 251 | 0.38 | 0.35 | [0.05, 0.97] |
| #9 | (Leaf) | 232 | 0.36 | 0.34 | [0.03, 0.96] |
| #10 | (Leaf) | 19 | 0.64 | 0.37 | [0.09, 0.98] |
---
## 4. Key Trends and Observations
1. **Primary Driver:** The initial split is based on `on_vent`. When `on_vent` is False (Node #1), the predicted "value" is significantly higher (0.81) compared to when it is True (Node #4, value 0.33).
2. **Age Influence:** Age is a recurring decision factor (Nodes #1, #4, and #8). In the `on_vent` True branch, a higher age (> 78.5) leads to a higher value (0.64 in Node #10) compared to younger groups.
3. **Sample Distribution:** The majority of the data (381/446 samples) follows the `on_vent > 0.5 = True` path.
4. **Confidence:** Node #3 shows the highest precision with the lowest standard deviation (0.14) and the narrowest 80% CI [0.7, 0.98].