# Technical Document Extraction: Decision Tree Analysis
## Overview
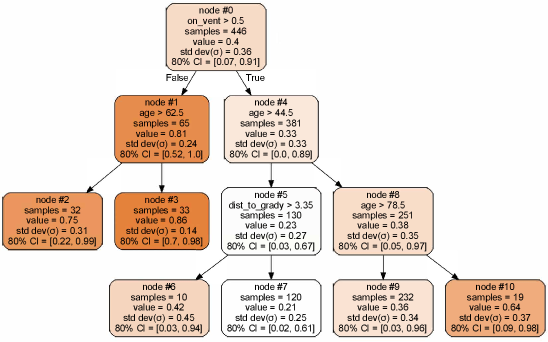
The image depicts a **decision tree** with hierarchical splits based on conditional thresholds. Nodes are labeled numerically (0–10) and contain statistical metrics. The tree splits on binary conditions (e.g., "on_vent > 0.5", "age > 62.5") and propagates sample counts, mean values, standard deviations, and confidence intervals (CI) to leaf nodes.
---
## Node Structure and Flow
### Root Node (#0)
- **Condition**: `on_vent > 0.5`
- **Samples**: 446
- **Value**: 0.4
- **Std Dev (σ)**: 0.36
- **80% CI**: [0.07, 0.91]
- **Branches**:
- **False** → Node #1
- **True** → Node #4
### Node #1 (False Branch of Root)
- **Condition**: `age > 62.5`
- **Samples**: 65
- **Value**: 0.81
- **Std Dev (σ)**: 0.24
- **80% CI**: [0.52, 1.0]
- **Branches**:
- **Left** → Node #2
- **Right** → Node #3
#### Node #2
- **Samples**: 32
- **Value**: 0.75
- **Std Dev (σ)**: 0.31
- **80% CI**: [0.22, 0.99]
#### Node #3
- **Samples**: 33
- **Value**: 0.86
- **Std Dev (σ)**: 0.14
- **80% CI**: [0.7, 0.98]
### Node #4 (True Branch of Root)
- **Condition**: `age > 44.5`
- **Samples**: 381
- **Value**: 0.33
- **Std Dev (σ)**: 0.33
- **80% CI**: [0.0, 0.89]
- **Branches**:
- **Left** → Node #5
- **Right** → Node #8
#### Node #5
- **Condition**: `dist_to_grady > 3.35`
- **Samples**: 130
- **Value**: 0.23
- **Std Dev (σ)**: 0.27
- **80% CI**: [0.03, 0.67]
- **Branches**:
- **Left** → Node #6
- **Right** → Node #7
##### Node #6
- **Samples**: 10
- **Value**: 0.42
- **Std Dev (σ)**: 0.45
- **80% CI**: [0.03, 0.94]
##### Node #7
- **Samples**: 120
- **Value**: 0.21
- **Std Dev (σ)**: 0.25
- **80% CI**: [0.02, 0.61]
#### Node #8
- **Condition**: `age > 78.5`
- **Samples**: 251
- **Value**: 0.38
- **Std Dev (σ)**: 0.35
- **80% CI**: [0.05, 0.97]
- **Branches**:
- **Left** → Node #9
- **Right** → Node #10
##### Node #9
- **Samples**: 232
- **Value**: 0.36
- **Std Dev (σ)**: 0.34
- **80% CI**: [0.03, 0.96]
##### Node #10
- **Samples**: 19
- **Value**: 0.64
- **Std Dev (σ)**: 0.37
- **80% CI**: [0.09, 0.98]
---
## Key Observations
1. **Hierarchical Splitting**:
- The tree splits on **age thresholds** (e.g., 44.5, 62.5, 78.5) and **distance to grady** (3.35).
- Leaf nodes represent terminal conditions with no further splits.
2. **Statistical Metrics**:
- **Value**: Likely represents a mean or median outcome (e.g., survival rate, error rate).
- **Std Dev (σ)**: Indicates variability within each node’s sample.
- **80% CI**: Confidence intervals suggest uncertainty ranges for the "Value" metric.
3. **Sample Distribution**:
- Root node has the largest sample (446), decreasing to leaf nodes (e.g., Node #6: 10 samples).
- Node #10 has the smallest sample (19) but the highest "Value" (0.64).
4. **Confidence Intervals**:
- Wider CIs (e.g., Node #1: [0.52, 1.0]) indicate higher uncertainty in smaller samples.
- Narrower CIs (e.g., Node #3: [0.7, 0.98]) suggest more reliable estimates.
---
## Diagram Components
- **Nodes**: Rectangular boxes with labels (e.g., "node #0").
- **Edges**: Arrows indicating conditional splits (e.g., "False" → Node #1).
- **Attributes**: Text within nodes specifying metrics (samples, value, σ, CI).
---
## Language and Transcription
- **Primary Language**: English.
- **No non-English text detected**.
---
## Spatial Grounding
- **Root Node (#0)**: Top-center position.
- **Branches**: Split into left (False) and right (True) children.
- **Leaf Nodes**: Terminal nodes (e.g., #2, #3, #6, #7, #9, #10) at the bottom of the tree.
---
## Trend Verification
- **Root to Leaf Flow**:
- Conditions narrow down samples (e.g., `age > 78.5` reduces samples to 251).
- "Value" fluctuates but shows no clear upward/downward trend.
- **Std Dev** generally decreases with smaller sample sizes (e.g., Node #3: σ=0.14 vs. Node #10: σ=0.37).
---
## Conclusion
This decision tree models a process with conditional splits based on age, ventilation status, and distance metrics. Statistical metrics (value, σ, CI) quantify outcomes and uncertainty at each node. Leaf nodes represent finalized conditions with varying sample sizes and confidence in results.