## Line Graphs: Qwen2.5-7B vs. Llama3.1-8B Performance
### Overview
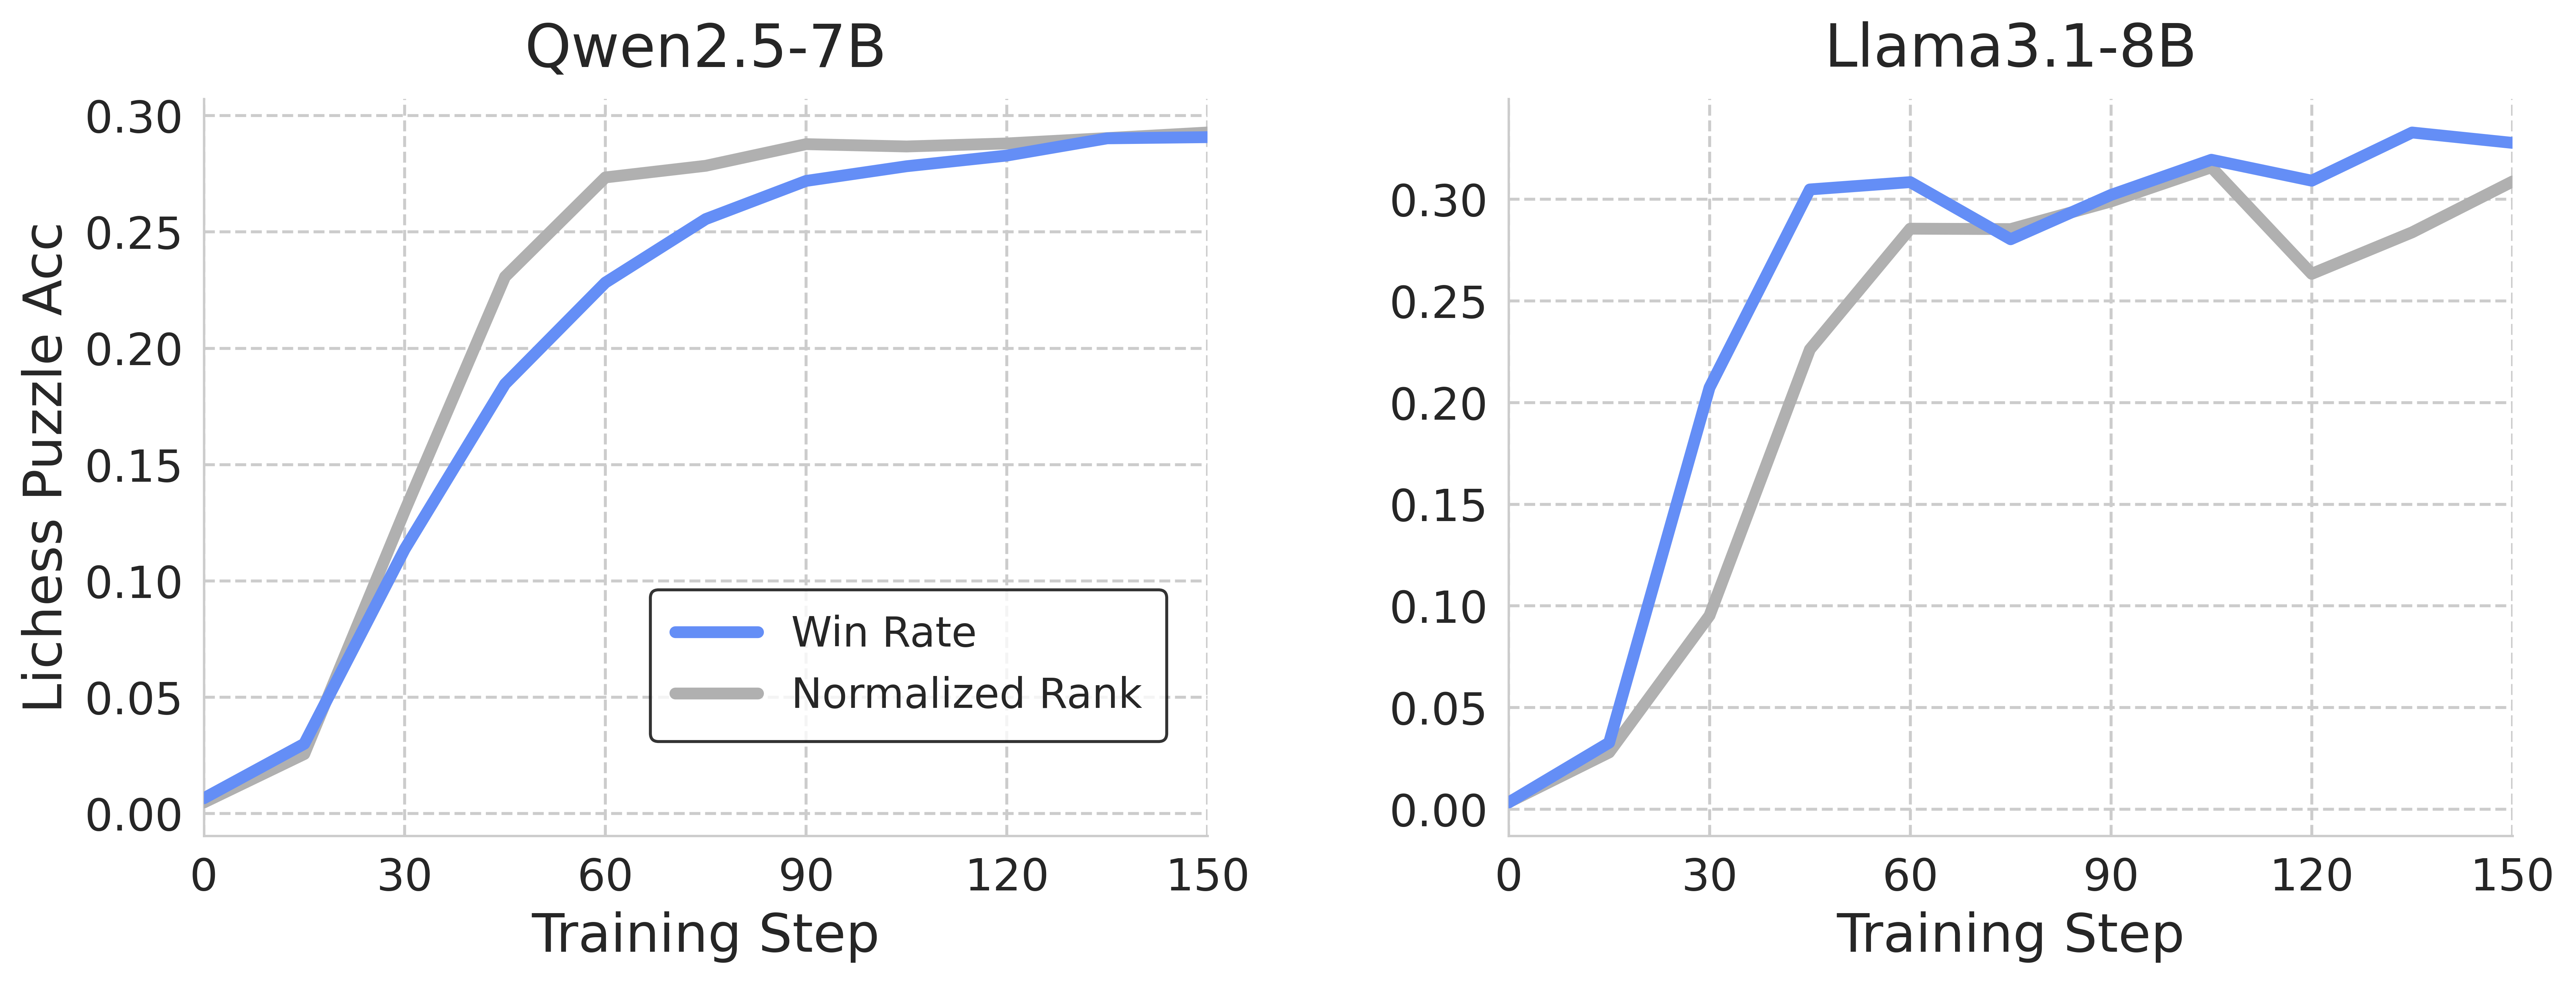
The image presents two line graphs comparing the performance of two language models, Qwen2.5-7B and Llama3.1-8B, on Lichess puzzle accuracy over training steps. Each graph plots the "Win Rate" and "Normalized Rank" against the "Training Step."
### Components/Axes
* **Titles:**
* Left Graph: Qwen2.5-7B
* Right Graph: Llama3.1-8B
* **X-axis (both graphs):**
* Label: Training Step
* Scale: 0 to 150, with tick marks at 0, 30, 60, 90, 120, and 150.
* **Y-axis (both graphs):**
* Label: Lichess Puzzle Acc
* Scale: 0.00 to 0.30, with tick marks at 0.00, 0.05, 0.10, 0.15, 0.20, 0.25, and 0.30.
* **Legend (located in the center-right of the left graph):**
* Blue line: Win Rate
* Gray line: Normalized Rank
### Detailed Analysis
**Left Graph: Qwen2.5-7B**
* **Win Rate (Blue):**
* Trend: Initially increases sharply, then plateaus.
* Data Points:
* Training Step 0: ~0.01
* Training Step 30: ~0.12
* Training Step 60: ~0.20
* Training Step 90: ~0.28
* Training Step 120: ~0.29
* Training Step 150: ~0.29
* **Normalized Rank (Gray):**
* Trend: Increases sharply, then plateaus at a slightly lower level than the Win Rate.
* Data Points:
* Training Step 0: ~0.01
* Training Step 30: ~0.03
* Training Step 60: ~0.23
* Training Step 90: ~0.28
* Training Step 120: ~0.29
* Training Step 150: ~0.29
**Right Graph: Llama3.1-8B**
* **Win Rate (Blue):**
* Trend: Increases sharply, then fluctuates around a plateau.
* Data Points:
* Training Step 0: ~0.01
* Training Step 30: ~0.30
* Training Step 60: ~0.29
* Training Step 90: ~0.31
* Training Step 120: ~0.33
* Training Step 150: ~0.29
* **Normalized Rank (Gray):**
* Trend: Increases sharply, then fluctuates, with a noticeable dip around Training Step 120.
* Data Points:
* Training Step 0: ~0.01
* Training Step 30: ~0.09
* Training Step 60: ~0.23
* Training Step 90: ~0.29
* Training Step 120: ~0.26
* Training Step 150: ~0.31
### Key Observations
* Both models show a rapid initial increase in both Win Rate and Normalized Rank.
* Qwen2.5-7B's performance plateaus more smoothly than Llama3.1-8B.
* Llama3.1-8B exhibits more fluctuation in both metrics after the initial increase.
* The Normalized Rank for Llama3.1-8B dips noticeably at Training Step 120.
### Interpretation
The graphs suggest that both Qwen2.5-7B and Llama3.1-8B quickly learn to solve Lichess puzzles, as indicated by the sharp initial increase in Win Rate and Normalized Rank. However, Llama3.1-8B's fluctuating performance after the initial learning phase may indicate instability or sensitivity to specific training steps. Qwen2.5-7B appears to have a more stable learning curve, reaching a similar level of performance but without the fluctuations observed in Llama3.1-8B. The dip in Llama3.1-8B's Normalized Rank at Training Step 120 could be due to a change in the training data or some other factor affecting the model's ability to maintain its ranking.