## Line Graphs: Qwen2.5-7B and Llama3.1-8B Performance Comparison
### Overview
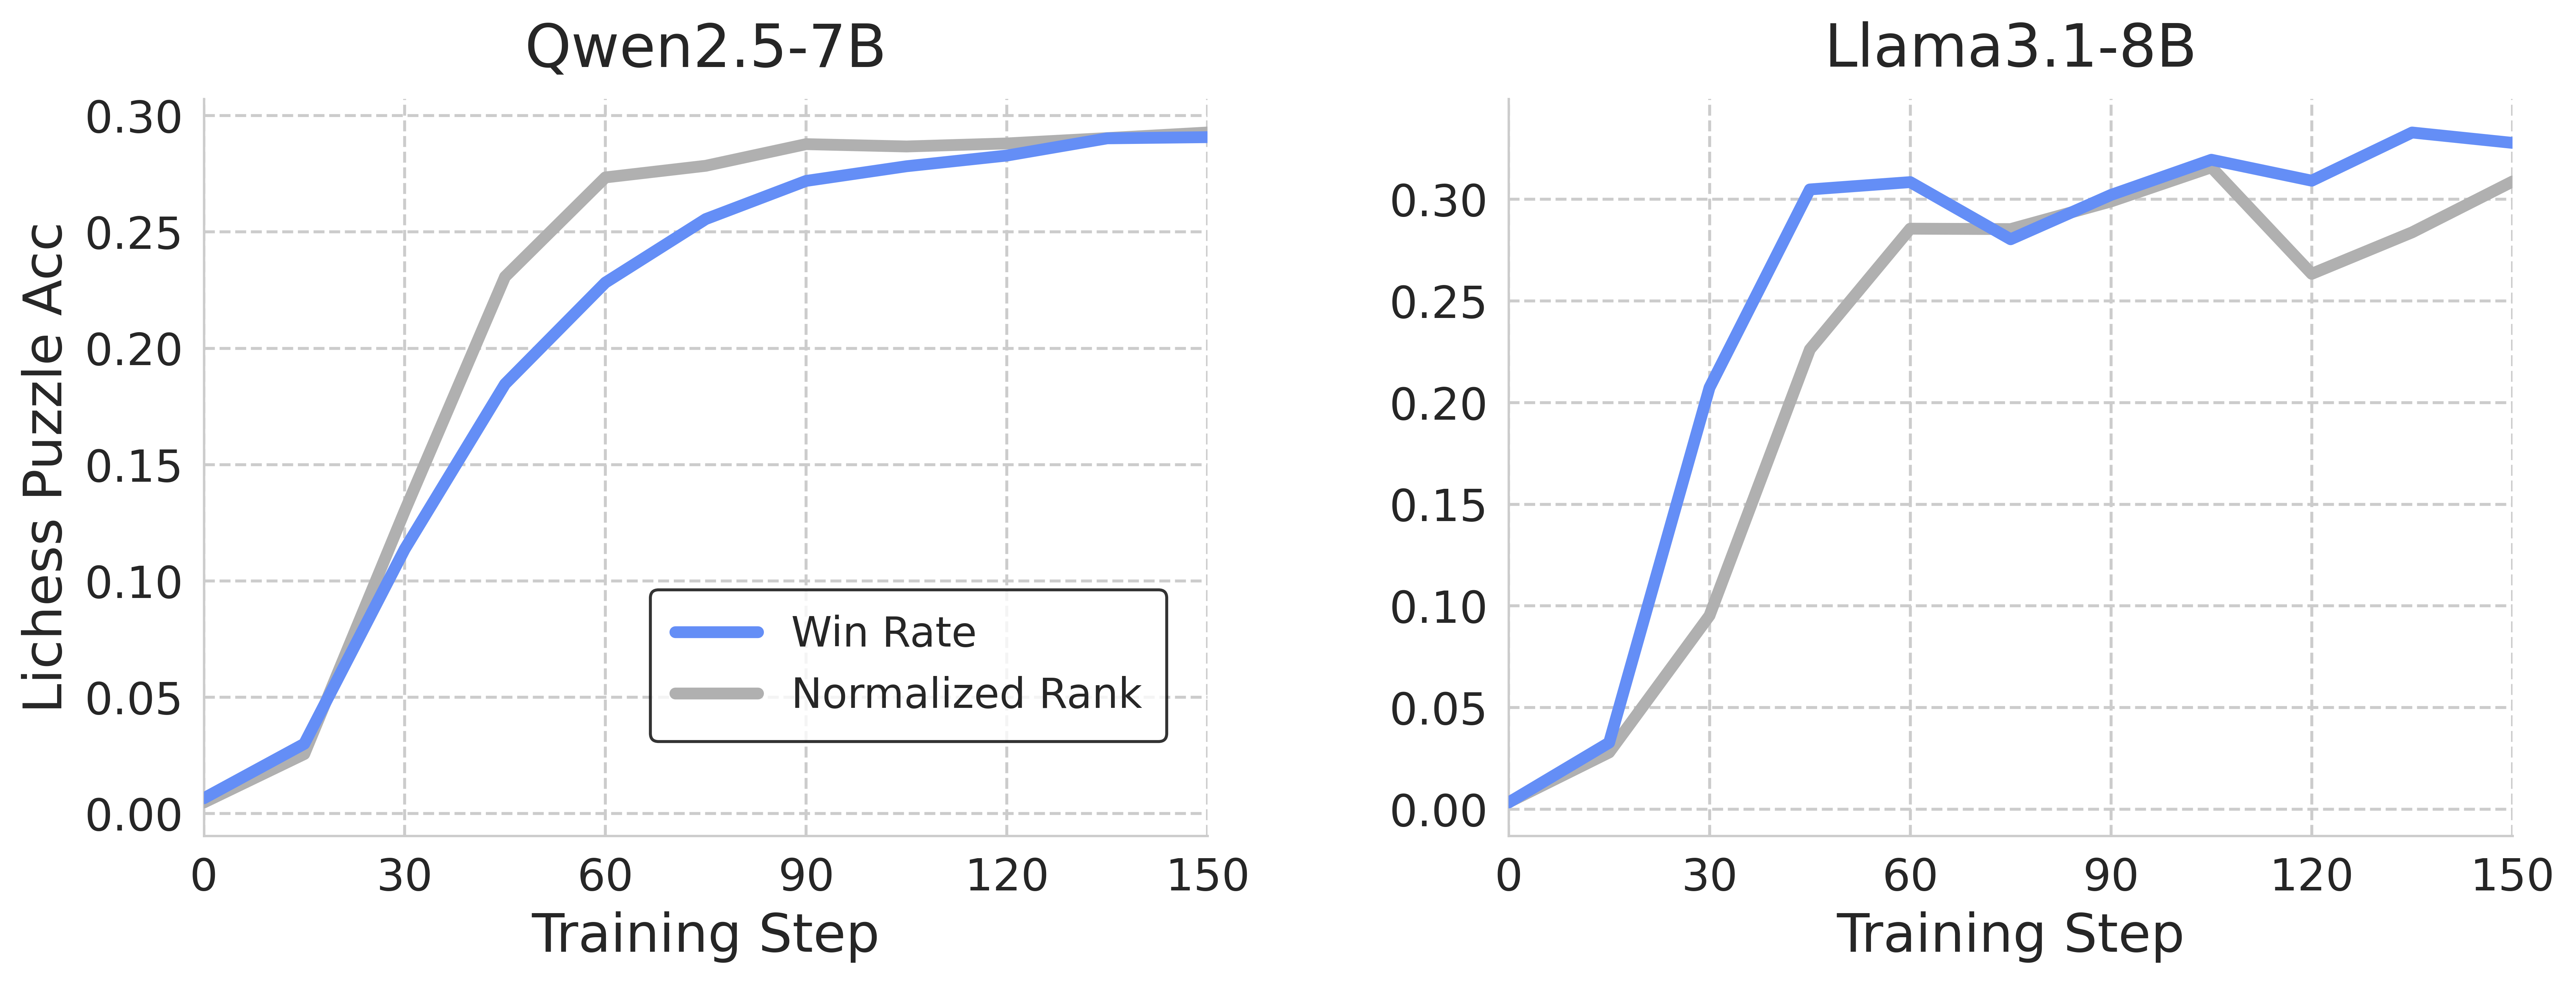
The image contains two side-by-side line graphs comparing the performance of two AI models (Qwen2.5-7B and Llama3.1-8B) across training steps. Both graphs track two metrics: **Win Rate** (blue line) and **Normalized Rank** (gray line) on the y-axis (Lichess Puzzle Accuracy) against **Training Steps** (0–150) on the x-axis.
---
### Components/Axes
- **X-Axis**: Training Steps (0–150, linear scale).
- **Y-Axis**: Lichess Puzzle Accuracy (0.00–0.30, linear scale).
- **Legends**:
- Blue line = Win Rate
- Gray line = Normalized Rank
- **Graph Titles**:
- Left: "Qwen2.5-7B"
- Right: "Llama3.1-8B"
---
### Detailed Analysis
#### Qwen2.5-7B (Left Graph)
- **Win Rate (Blue Line)**:
- Starts at ~0.00 at 0 steps.
- Increases steadily, reaching ~0.28 at 150 steps.
- Slope: Gradual upward trend with no plateaus.
- **Normalized Rank (Gray Line)**:
- Starts at ~0.01 at 0 steps.
- Rises sharply initially, then plateaus slightly above the blue line.
- Peaks at ~0.29 at 150 steps.
- **Key Relationship**: The gray line remains consistently ~0.01–0.02 higher than the blue line throughout.
#### Llama3.1-8B (Right Graph)
- **Win Rate (Blue Line)**:
- Starts at ~0.00 at 0 steps.
- Sharp upward spike after ~30 steps, reaching ~0.30 at 150 steps.
- Temporary dip to ~0.26 at ~90 steps, then recovery.
- **Normalized Rank (Gray Line)**:
- Starts at ~0.01 at 0 steps.
- Gradual rise, peaking at ~0.28 at 150 steps.
- Crossed by the blue line after ~60 steps.
- **Key Relationship**: Blue line overtakes gray line after ~60 steps, indicating Win Rate surpasses Normalized Rank.
---
### Key Observations
1. **Qwen2.5-7B**:
- Win Rate and Normalized Rank trends are closely aligned but never intersect.
- Both metrics plateau near 0.28–0.29 by 150 steps.
2. **Llama3.1-8B**:
- Win Rate accelerates faster than Normalized Rank, overtaking it after ~60 steps.
- Temporary dip in Win Rate at ~90 steps suggests instability or optimization challenges.
3. **General Trend**:
- Both models show improvement with training steps, but Llama3.1-8B demonstrates sharper gains in Win Rate.
---
### Interpretation
- **Performance Insights**:
- Llama3.1-8B’s faster Win Rate growth suggests superior puzzle-solving efficiency in later training phases.
- Qwen2.5-7B’s stable but slower progression indicates consistent but less aggressive learning.
- **Anomalies**:
- Llama3.1-8B’s Win Rate dip at ~90 steps may reflect overfitting or resource constraints during training.
- **Implications**:
- For applications prioritizing rapid performance gains, Llama3.1-8B may be preferable.
- Qwen2.5-7B’s stability could be advantageous for tasks requiring consistent, incremental improvement.
---
### Spatial Grounding & Validation
- Legends are positioned at the bottom-left of each graph, matching line colors (blue/gray).
- Axis labels and titles are clearly separated from data regions.
- All numerical values align with visual trends (e.g., Llama’s blue line overtaking gray line post-60 steps).