## Neural Network Diagram: Routing and Expert Selection
### Overview
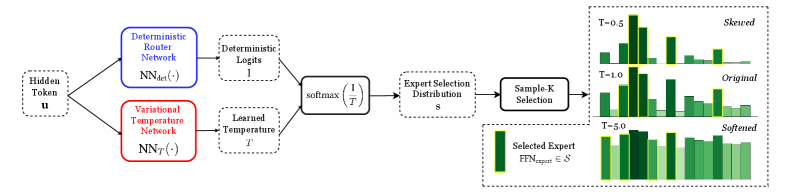
The image presents a diagram illustrating a neural network architecture for routing and expert selection. It shows how a hidden token is processed through two separate networks, combined using a softmax function, and then used to select an expert from a distribution. The diagram also visualizes the effect of different temperature values on the expert selection distribution.
### Components/Axes
* **Input:** Hidden Token (u) - Represented by a dashed rounded rectangle.
* **Routing Networks:**
* Deterministic Router Network (Blue rectangle): NNdet(·)
* Variational Temperature Network (Red rectangle): NNT(·)
* **Outputs of Routing Networks:**
* Deterministic Logits (1) - Output of the Deterministic Router Network. Represented by a dashed rounded rectangle.
* Learned Temperature (T) - Output of the Variational Temperature Network. Represented by a dashed rounded rectangle.
* **Softmax Function:** softmax(1/T) - Combines the outputs of the two networks. Represented by a solid rectangle.
* **Expert Selection Distribution:** S - Represents the distribution of experts. Represented by a dashed rounded rectangle.
* **Sample-K Selection:** Selects a subset of experts based on the distribution. Represented by a solid rectangle.
* **Selected Expert:** FFNexpert ∈ S - Represents the selected expert from the distribution.
* **Histograms:** Three histograms showing the expert selection distribution for different temperature values (T=0.5, T=1.0, T=5.0).
### Detailed Analysis
* **Flow:** The diagram shows a clear flow from left to right. The Hidden Token is fed into two parallel networks. Their outputs are combined using a softmax function, which then determines the Expert Selection Distribution. Finally, a Sample-K Selection process chooses an expert.
* **Deterministic Router Network:** Takes the Hidden Token as input and outputs Deterministic Logits, which are represented as '1'.
* **Variational Temperature Network:** Takes the Hidden Token as input and outputs a Learned Temperature, represented as 'T'.
* **Softmax Function:** The softmax function takes the inverse of the Learned Temperature (1/T) as input.
* **Expert Selection Distribution:** The output of the softmax function is used to create an Expert Selection Distribution, denoted as 'S'.
* **Sample-K Selection:** This step selects a subset of experts based on the Expert Selection Distribution.
* **Histograms:**
* **T=0.5 (Skewed):** The histogram shows a highly skewed distribution, with a few experts having significantly higher probabilities than others. The bars are light green with yellow outlines.
* **T=1.0 (Original):** The histogram shows a more balanced distribution compared to T=0.5, but still with some variation in probabilities. The bars are green with yellow outlines.
* **T=5.0 (Softened):** The histogram shows a much more uniform distribution, with all experts having relatively similar probabilities. The bars are dark green with yellow outlines.
### Key Observations
* The temperature 'T' significantly affects the expert selection distribution. Lower temperatures (T=0.5) lead to skewed distributions, while higher temperatures (T=5.0) lead to softened, more uniform distributions.
* The diagram highlights the use of a variational temperature to control the exploration-exploitation trade-off in expert selection.
### Interpretation
The diagram illustrates a neural network architecture that uses a combination of deterministic routing and variational temperature to dynamically select experts from a distribution. The variational temperature allows the network to control the degree of exploration in expert selection.
* **Low Temperature (T=0.5):** The network focuses on a small subset of experts, potentially leading to faster learning but also a higher risk of overfitting or getting stuck in local optima. This is described as "Skewed".
* **Intermediate Temperature (T=1.0):** The network balances exploration and exploitation, allowing it to learn from a wider range of experts while still focusing on the most promising ones. This is described as "Original".
* **High Temperature (T=5.0):** The network explores a wider range of experts, potentially leading to slower learning but also a lower risk of overfitting and a better chance of finding the global optimum. This is described as "Softened".
The architecture allows for adaptive expert selection based on the input data and the learned temperature, enabling the network to dynamically adjust its behavior to optimize performance.