## Flowchart: Deterministic and Variational Temperature Networks with Expert Selection
### Overview
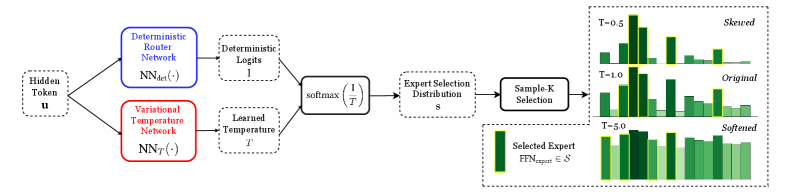
The image depicts a technical workflow for expert selection in a neural network system. It combines deterministic and variational components to route hidden tokens through specialized experts, visualized through three histogram distributions showing temperature parameter effects.
### Components/Axes
1. **Left Diagram (Flowchart)**
- **Inputs**: Hidden Token `u`
- **Components**:
- Deterministic Router Network (blue box): `NN_det(·)`
- Variational Temperature Network (red box): `NN_T(·)`
- Deterministic Logits: `logits₁`
- Learned Temperature: `T`
- Softmax Function: `softmax(1/T)`
- Expert Selection Distribution: `s`
- Sample-K Selection: `FFN_expert ∈ S`
- **Output**: Selected Expert (green box)
2. **Right Histograms**
- **X-axis**: Expert Index (0-10)
- **Y-axis**: Probability (0-0.15)
- **Legend**:
- T=-0.5: Dark green (Skewed)
- T=-1.0: Medium green (Original)
- T=-5.0: Light green (Softened)
### Detailed Analysis
1. **Flowchart Path**:
- Hidden token `u` splits into two parallel paths:
- **Deterministic Path**: Processes through `NN_det` → `logits₁`
- **Variational Path**: Processes through `NN_T` → Learned Temperature `T`
- Combined outputs feed into `softmax(1/T)` to create selection distribution `s`
- Final `Sample-K Selection` samples from `s` to select expert `FFN_expert`
2. **Histogram Trends**:
- **T=-0.5 (Skewed)**:
- Sharp peak at expert index 2 (probability ~0.12)
- Long tail extending to index 8 (probability ~0.03)
- **T=-1.0 (Original)**:
- Multiple peaks at indices 1, 3, and 7 (probabilities ~0.08-0.10)
- More uniform distribution than T=-0.5
- **T=-5.0 (Softened)**:
- Flattened distribution across indices 0-10
- All probabilities ~0.05-0.07
- Uniform height with minimal variation
### Key Observations
1. Temperature parameter `T` inversely affects distribution shape:
- Higher |T| values (more negative) → More uniform distributions
- Lower |T| values → More skewed distributions
2. Softmax temperature scaling:
- `1/T` amplifies differences between logits at lower temperatures
- At T=-5.0, all experts receive nearly equal probability
3. Histogram color coding matches legend exactly:
- Dark green (T=-0.5) shows strongest skewness
- Light green (T=-5.0) shows strongest softening
### Interpretation
This system demonstrates temperature-controlled expert selection:
- **Deterministic vs. Variational Balance**: The dual-path architecture allows both fixed routing (deterministic) and adaptive temperature-based routing (variational)
- **Temperature Effects**: Negative temperatures create competition between experts (skewed distributions), while large negative temperatures promote uniform selection
- **Practical Implications**: The T=-5.0 "softened" distribution suggests a strategy for preventing catastrophic forgetting by maintaining expertise diversity
- **Visual Confirmation**: The color-coded histograms provide immediate visual validation of temperature effects, with darker colors indicating stronger selection pressure
The architecture enables dynamic expert selection while maintaining control over distribution characteristics through temperature parameterization.