## Line Charts: Loss and Average Reward
### Overview
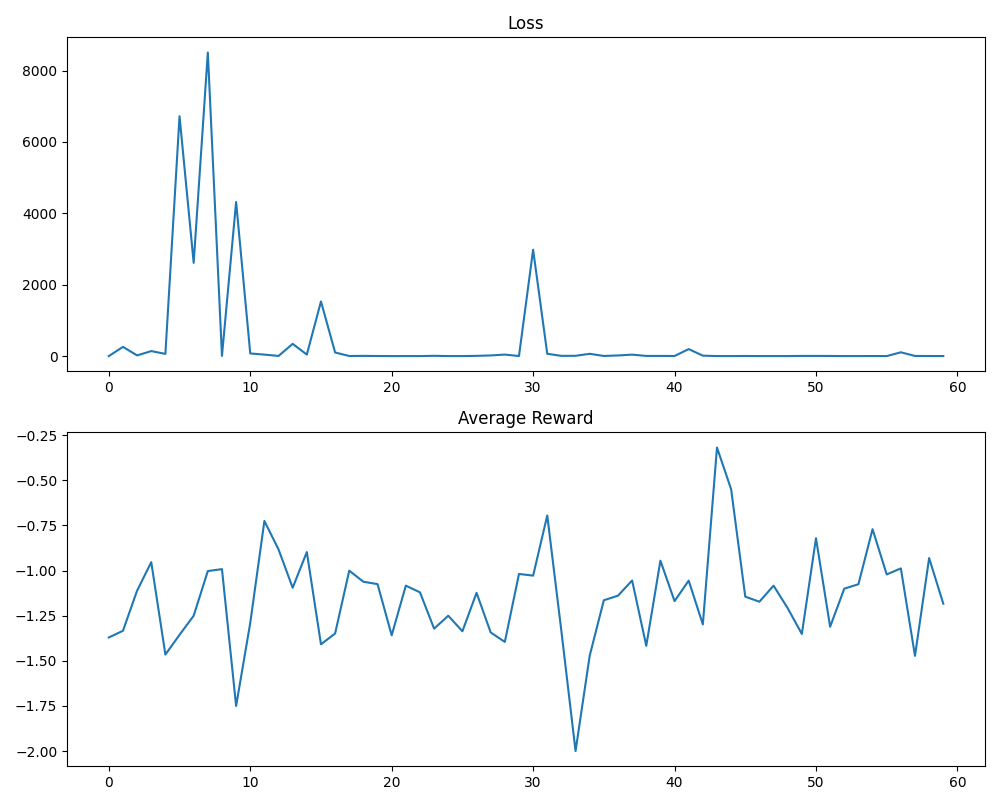
The image contains two line charts, one above the other. The top chart displays "Loss" values, and the bottom chart displays "Average Reward" values. Both charts share a common x-axis representing a sequence of steps or iterations, ranging from 0 to 60.
### Components/Axes
**Top Chart: Loss**
* **Title:** Loss
* **Y-axis:** Represents the Loss value, ranging from 0 to 8000.
* **X-axis:** Represents the step or iteration, ranging from 0 to 60.
* **Data Series:** A single blue line representing the loss values.
**Bottom Chart: Average Reward**
* **Title:** Average Reward
* **Y-axis:** Represents the Average Reward, ranging from -2.00 to -0.25.
* **X-axis:** Represents the step or iteration, ranging from 0 to 60.
* **Data Series:** A single blue line representing the average reward values.
### Detailed Analysis
**Top Chart: Loss**
The loss values fluctuate significantly in the early iterations (0-10), with peaks around 6700 at x=4, 8300 at x=7, and 4300 at x=9. After x=20, the loss values stabilize and remain close to 0 for the remaining iterations, with a small peak of approximately 3000 at x=31.
* x=0: Loss ≈ 100
* x=4: Loss ≈ 6700
* x=7: Loss ≈ 8300
* x=9: Loss ≈ 4300
* x=15: Loss ≈ 1500
* x=31: Loss ≈ 3000
* x=60: Loss ≈ 0
**Bottom Chart: Average Reward**
The average reward fluctuates between approximately -1.5 and -0.75 for most of the iterations. There are notable dips around x=10 (approximately -1.75) and x=33 (approximately -2.00), and a peak around x=43 (approximately -0.3).
* x=0: Average Reward ≈ -1.3
* x=10: Average Reward ≈ -1.75
* x=33: Average Reward ≈ -2.00
* x=43: Average Reward ≈ -0.3
* x=60: Average Reward ≈ -1.1
### Key Observations
* The Loss chart shows a significant decrease in loss after the initial iterations, indicating that the model is learning.
* The Average Reward chart shows fluctuations, but generally remains within a relatively narrow range.
### Interpretation
The charts likely represent the training progress of a machine learning model. The "Loss" chart indicates the error rate of the model, which decreases over time as the model learns. The "Average Reward" chart indicates the performance of the model in terms of reward, which fluctuates but does not show a clear upward trend. The initial high loss values suggest that the model is initially making large errors, but as it trains, the errors decrease significantly. The fluctuations in average reward could be due to the stochastic nature of the environment or the exploration-exploitation trade-off.