## Line Graphs: Loss and Average Reward Trends
### Overview
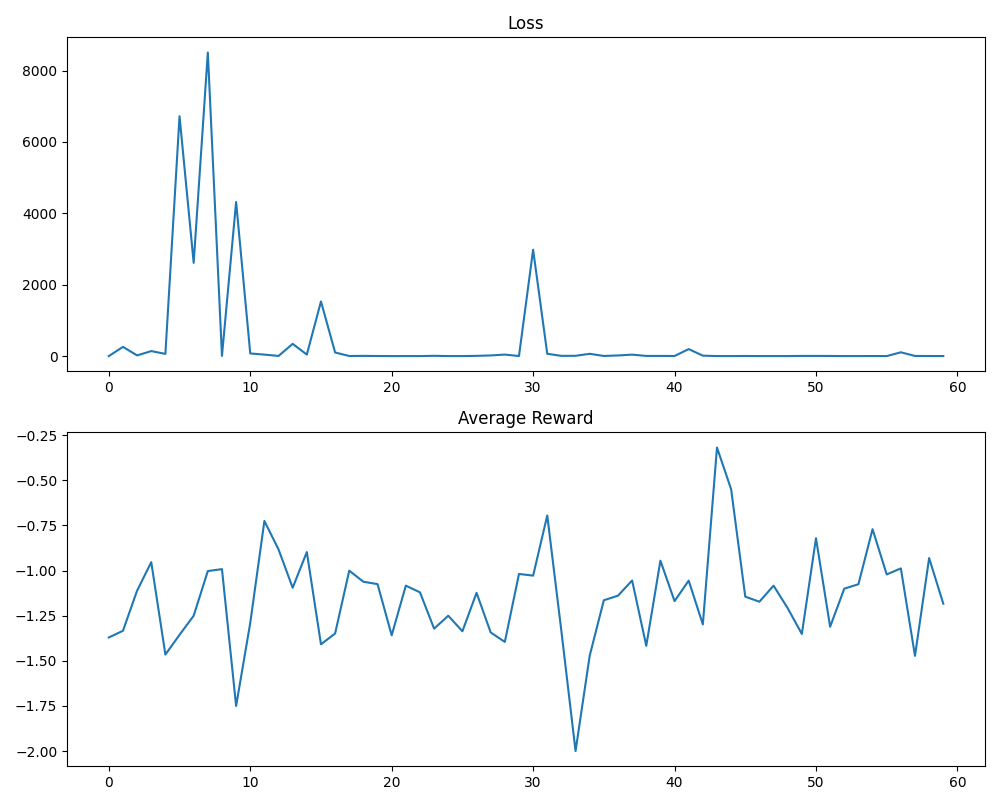
The image contains two line graphs stacked vertically. The top graph tracks "Loss" over an x-axis labeled "Average Reward" (0–60), while the bottom graph tracks "Average Reward" over the same x-axis. Both graphs use a single blue line to represent their respective metrics, with distinct y-axis scales and volatility patterns.
---
### Components/Axes
- **Top Graph (Loss):**
- **Y-axis (Loss):** Ranges from 0 to 8000 in increments of 2000.
- **X-axis (Average Reward):** Labeled "Average Reward," spans 0 to 60 in increments of 10.
- **Line:** Blue, with sharp peaks and troughs.
- **Legend:** Not explicitly visible, but the line is blue.
- **Bottom Graph (Average Reward):**
- **Y-axis (Average Reward):** Ranges from -2.00 to -0.25 in increments of 0.25.
- **X-axis (Average Reward):** Same as the top graph (0–60).
- **Line:** Blue, with gradual fluctuations and a sharp dip.
- **Legend:** Not explicitly visible, but the line is blue.
---
### Detailed Analysis
#### Top Graph (Loss)
- **Trend:** The line begins near 0, spikes to **~8000 at x=5**, drops to **~4000 at x=8**, then fluctuates with smaller peaks (e.g., **~2000 at x=15** and **~3000 at x=30**). After x=30, the line stabilizes near 0 with minor oscillations.
- **Key Data Points:**
- Peak: **~8000** at x=5 (highest loss).
- Secondary peak: **~4000** at x=8.
- Stabilization: Near 0 after x=30.
#### Bottom Graph (Average Reward)
- **Trend:** The line starts at **~-1.50**, fluctuates between **~-1.75 and ~-0.25**, with a sharp dip to **~-2.00 at x=32**. After x=32, it recovers to **~-1.00** by x=45, then stabilizes with smaller oscillations.
- **Key Data Points:**
- Initial value: **~-1.50** at x=0.
- Sharp dip: **~-2.00** at x=32 (lowest reward).
- Recovery: **~-1.00** at x=45.
---
### Key Observations
1. **Loss Volatility:** The top graph shows extreme spikes (e.g., x=5, x=30), suggesting instability or overfitting in the modeled system.
2. **Reward Dip:** The bottom graph’s sharp drop at x=32 correlates with a potential event (e.g., parameter reset, data shift) that temporarily degraded performance.
3. **Divergence:** While Loss stabilizes after x=30, Average Reward remains volatile, indicating a disconnect between error magnitude and reward consistency.
---
### Interpretation
- **Loss Spikes:** The abrupt increases in Loss (e.g., x=5, x=30) may reflect moments of high error, possibly due to overfitting, noisy data, or abrupt changes in the training environment. The stabilization post-x=30 suggests improved model robustness.
- **Reward Dip at x=32:** The sharp decline in Average Reward aligns with a potential intervention (e.g., hyperparameter adjustment, data corruption) that temporarily reduced performance. Recovery by x=45 implies the system adapted or corrected the issue.
- **System Behavior:** The graphs highlight a trade-off between error magnitude (Loss) and performance consistency (Average Reward). The model shows learning progress (decreasing Loss) but struggles with stability, as evidenced by persistent reward fluctuations.
---
### Spatial Grounding
- **Legend:** Absent; line color (blue) is consistent across both graphs.
- **Positioning:** Top graph occupies the upper half, bottom graph the lower half. Both share the same x-axis label ("Average Reward"), which may indicate a shared temporal or iterative scale (e.g., training steps).
---
### Content Details
- **Loss Values:** Peaks at **~8000** (x=5), **~4000** (x=8), and **~3000** (x=30); stabilizes near 0 after x=30.
- **Average Reward Values:** Ranges from **~-2.00** (x=32) to **~-0.25** (x=15); stabilizes around **~-1.00** post-x=45.
---
### Final Notes
The graphs suggest a dynamic system where Loss and Reward metrics are inversely related but not perfectly correlated. The sharp dip in Reward at x=32 warrants further investigation into potential external factors or model adjustments. The absence of a legend simplifies interpretation but limits clarity on multiple data series.