## Line Charts: Age-Specific Rates in Spain (Logarithmic Scale)
### Overview
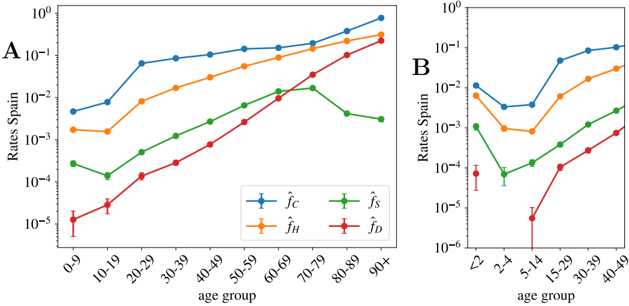
The image contains two side-by-side line charts (labeled A and B) displaying age-specific rates on a logarithmic scale. Both charts plot four different metrics (denoted by symbols f̂_C, f̂_H, f̂_S, f̂_D) against age groups. The y-axis for both is labeled "Rates Spain" and uses a base-10 logarithmic scale. The charts appear to show epidemiological or demographic rates, with chart A covering a broad lifespan and chart B focusing on younger age groups with finer granularity.
### Components/Axes
**Chart A (Left Panel):**
* **Title/Label:** "A" (top-left corner).
* **Y-axis:** Label: "Rates Spain". Scale: Logarithmic, ranging from 10⁻⁵ to 10⁰ (0.00001 to 1). Major tick marks at each power of 10.
* **X-axis:** Label: "age group". Categories (left to right): "0-9", "10-19", "20-29", "30-39", "40-49", "50-59", "60-69", "70-79", "80-89", "90+".
* **Legend:** Located in the bottom-right quadrant of the chart area. It defines four data series:
* Blue line with circle markers: `f̂_C`
* Orange line with square markers: `f̂_H`
* Green line with diamond markers: `f̂_S`
* Red line with triangle markers: `f̂_D`
**Chart B (Right Panel):**
* **Title/Label:** "B" (top-left corner).
* **Y-axis:** Label: "Rates Spain". Scale: Logarithmic, ranging from 10⁻⁶ to 10⁰ (0.000001 to 1). Major tick marks at each power of 10.
* **X-axis:** Label: "age group". Categories (left to right): "0-1", "2-4", "5-14", "15-29", "30-39", "40-49".
* **Legend:** Not explicitly shown in panel B, but the line colors and marker styles are consistent with the legend in panel A, allowing for direct cross-reference.
### Detailed Analysis
**Chart A - Trends and Approximate Data Points:**
* **General Trend:** All four rates show a strong, consistent increase with age. The lines are roughly parallel on the log scale, indicating multiplicative growth.
* **f̂_C (Blue, Circles):** The highest rate across all age groups. Starts at ~4x10⁻³ (0.004) for ages 0-9, rises steadily to ~8x10⁻¹ (0.8) for ages 90+.
* **f̂_H (Orange, Squares):** The second-highest rate. Starts at ~2x10⁻³ (0.002) for 0-9, increases to ~3x10⁻¹ (0.3) for 90+.
* **f̂_S (Green, Diamonds):** Starts lower at ~3x10⁻⁴ (0.0003) for 0-9, shows a slight dip at 10-19 (~1x10⁻⁴), then increases to ~2x10⁻² (0.02) for 70-79 before declining slightly for 80-89 and 90+.
* **f̂_D (Red, Triangles):** The lowest rate. Starts at ~1x10⁻⁵ (0.00001) for 0-9, increases most steeply in later life, reaching ~2x10⁻¹ (0.2) for 90+.
**Chart B - Trends and Approximate Data Points:**
* **General Trend:** This chart reveals a non-monotonic pattern for younger ages. Rates are relatively high for infants (0-1), drop to a minimum in early childhood (2-4 or 5-14), and then rise again through adolescence and adulthood.
* **f̂_C (Blue, Circles):** ~1x10⁻² (0.01) for 0-1, dips to ~3x10⁻³ (0.003) for 2-4, then rises sharply to ~1x10⁻¹ (0.1) by ages 40-49.
* **f̂_H (Orange, Squares):** ~6x10⁻³ (0.006) for 0-1, dips to ~8x10⁻⁴ (0.0008) for 2-4, then rises to ~3x10⁻² (0.03) by 40-49.
* **f̂_S (Green, Diamonds):** ~1x10⁻³ (0.001) for 0-1, dips to ~6x10⁻⁵ (0.00006) for 2-4, then rises to ~3x10⁻³ (0.003) by 40-49.
* **f̂_D (Red, Triangles):** ~7x10⁻⁵ (0.00007) for 0-1, dips to a very low ~5x10⁻⁶ (0.000005) for 5-14, then rises to ~1x10⁻³ (0.001) by 40-49.
### Key Observations
1. **Age Gradient:** The dominant pattern in Chart A is a powerful, near-exponential increase in all four rates with advancing age.
2. **Hierarchy of Rates:** A consistent order is maintained across most ages: f̂_C > f̂_H > f̂_S > f̂_D. The gap between f̂_C and the others is substantial.
3. **Infant/Child Anomaly (Chart B):** The "U-shaped" or "check-mark" curve in Chart B highlights that the very youngest age group (0-1) has higher rates than young children (2-14), a pattern obscured by the broader age bins in Chart A.
4. **Convergence at Advanced Age (Chart A):** While f̂_C remains highest, the rates for f̂_H and f̂_D appear to converge toward f̂_C in the oldest age groups (80+), suggesting the relative differences may narrow very late in life.
5. **Steepness of Increase:** The slope of f̂_D (red) appears the steepest on the log scale from middle age onward, indicating it has the fastest *relative* rate of increase with age during that period.
### Interpretation
The data strongly suggests that the measured phenomena (likely health-related events such as incidence, mortality, or hospitalization rates) are profoundly age-dependent. The near-parallel log-linear trends in Chart A imply that age acts as a common multiplicative risk factor for all four metrics.
The hierarchy (C > H > S > D) indicates these are likely distinct but related events, with `f̂_C` being the most common and `f̂_D` the rarest. The specific meaning of the symbols (C, H, S, D) is not provided, but in epidemiological contexts, they could represent categories like "Cases," "Hospitalizations," "Severe outcomes," and "Deaths."
Chart B's critical insight is the elevated rate in infancy (0-1), which is a classic pattern for many health outcomes (e.g., neonatal mortality, congenital conditions). The subsequent dip in early childhood reflects a period of generally lower risk before the age-associated rise begins. This nuance is lost in the broader age groupings of Chart A.
The convergence of lines at very old ages in Chart A could be due to a "ceiling effect" (rates cannot exceed 1) or may reflect the competing risks and selective survival of the oldest-old population. The charts, when read together, provide a comprehensive view: Chart A shows the lifelong trajectory, while Chart B zooms in on the complex risk profile of early life.