## Scatter Plot Matrix: Variance Explained by Principal Components
### Overview
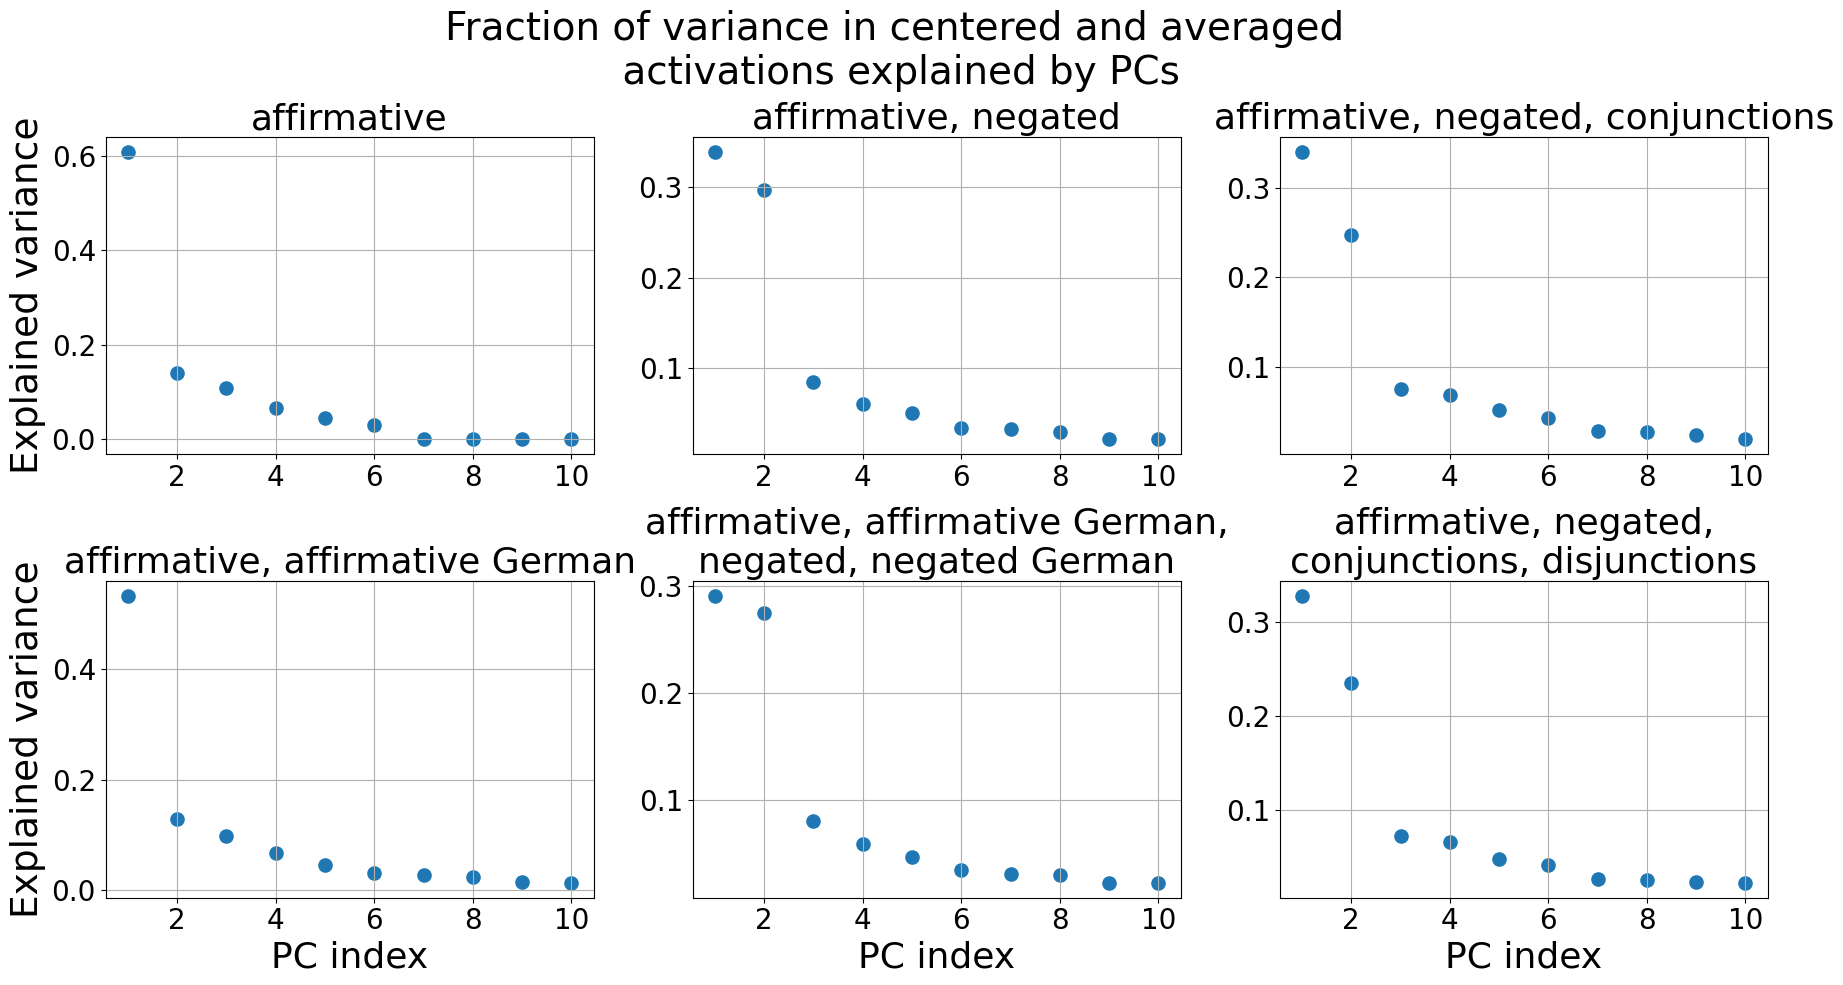
The image presents a matrix of six scatter plots. Each plot shows the fraction of variance in centered and averaged activations explained by principal components (PCs) for different linguistic conditions. The x-axis represents the PC index (from 1 to 10), and the y-axis represents the explained variance (from 0.0 to either 0.6 or 0.3, depending on the plot). All data points are blue circles. Each plot corresponds to a different combination of affirmative, negated, conjunction, disjunction, and German language conditions.
### Components/Axes
* **Title:** "Fraction of variance in centered and averaged activations explained by PCs"
* **X-axis (PC index):** Ranges from 1 to 10, with integer markers at each value.
* **Y-axis (Explained variance):** Ranges from 0.0 to 0.6 for the "affirmative" plot and from 0.0 to 0.3 for the other plots, with markers at 0.0, 0.1, 0.2, 0.3, 0.4, 0.6.
* **Plot Titles (from top-left to bottom-right):**
* "affirmative"
* "affirmative, negated"
* "affirmative, negated, conjunctions"
* "affirmative, affirmative German"
* "affirmative, affirmative German, negated, negated German"
* "affirmative, negated, conjunctions, disjunctions"
### Detailed Analysis
Each plot shows a decreasing trend in explained variance as the PC index increases. The first PC explains the most variance, and subsequent PCs explain progressively less.
* **Affirmative:**
* PC 1 explains approximately 0.61 of the variance.
* PC 2 explains approximately 0.14 of the variance.
* PC 3 explains approximately 0.11 of the variance.
* PC 4 explains approximately 0.07 of the variance.
* PC 5 explains approximately 0.05 of the variance.
* PC 6 explains approximately 0.03 of the variance.
* PC 7 explains approximately 0.01 of the variance.
* PC 8 explains approximately 0.01 of the variance.
* PC 9 explains approximately 0.00 of the variance.
* PC 10 explains approximately 0.00 of the variance.
* **Affirmative, Negated:**
* PC 1 explains approximately 0.33 of the variance.
* PC 2 explains approximately 0.29 of the variance.
* PC 3 explains approximately 0.09 of the variance.
* PC 4 explains approximately 0.06 of the variance.
* PC 5 explains approximately 0.05 of the variance.
* PC 6 explains approximately 0.04 of the variance.
* PC 7 explains approximately 0.03 of the variance.
* PC 8 explains approximately 0.03 of the variance.
* PC 9 explains approximately 0.02 of the variance.
* PC 10 explains approximately 0.02 of the variance.
* **Affirmative, Negated, Conjunctions:**
* PC 1 explains approximately 0.33 of the variance.
* PC 2 explains approximately 0.24 of the variance.
* PC 3 explains approximately 0.07 of the variance.
* PC 4 explains approximately 0.07 of the variance.
* PC 5 explains approximately 0.05 of the variance.
* PC 6 explains approximately 0.04 of the variance.
* PC 7 explains approximately 0.03 of the variance.
* PC 8 explains approximately 0.03 of the variance.
* PC 9 explains approximately 0.02 of the variance.
* PC 10 explains approximately 0.02 of the variance.
* **Affirmative, Affirmative German:**
* PC 1 explains approximately 0.48 of the variance.
* PC 2 explains approximately 0.13 of the variance.
* PC 3 explains approximately 0.09 of the variance.
* PC 4 explains approximately 0.06 of the variance.
* PC 5 explains approximately 0.04 of the variance.
* PC 6 explains approximately 0.03 of the variance.
* PC 7 explains approximately 0.02 of the variance.
* PC 8 explains approximately 0.01 of the variance.
* PC 9 explains approximately 0.01 of the variance.
* PC 10 explains approximately 0.01 of the variance.
* **Affirmative, Affirmative German, Negated, Negated German:**
* PC 1 explains approximately 0.29 of the variance.
* PC 2 explains approximately 0.08 of the variance.
* PC 3 explains approximately 0.06 of the variance.
* PC 4 explains approximately 0.04 of the variance.
* PC 5 explains approximately 0.04 of the variance.
* PC 6 explains approximately 0.03 of the variance.
* PC 7 explains approximately 0.02 of the variance.
* PC 8 explains approximately 0.02 of the variance.
* PC 9 explains approximately 0.01 of the variance.
* PC 10 explains approximately 0.01 of the variance.
* **Affirmative, Negated, Conjunctions, Disjunctions:**
* PC 1 explains approximately 0.33 of the variance.
* PC 2 explains approximately 0.23 of the variance.
* PC 3 explains approximately 0.07 of the variance.
* PC 4 explains approximately 0.07 of the variance.
* PC 5 explains approximately 0.04 of the variance.
* PC 6 explains approximately 0.04 of the variance.
* PC 7 explains approximately 0.03 of the variance.
* PC 8 explains approximately 0.02 of the variance.
* PC 9 explains approximately 0.02 of the variance.
* PC 10 explains approximately 0.02 of the variance.
### Key Observations
* The "affirmative" condition has the highest explained variance by the first PC (approximately 0.61), indicating that the first principal component captures a larger portion of the variance in this condition compared to the others.
* The addition of negation, conjunctions, and disjunctions generally reduces the explained variance by the first PC.
* The inclusion of German language data also appears to reduce the explained variance by the first PC.
* In all conditions, the explained variance decreases rapidly after the first few PCs, suggesting that the first few components are the most important for capturing the variance in the data.
### Interpretation
The data suggests that the linguistic conditions (affirmation, negation, conjunction, disjunction, and language) influence the variance explained by the principal components of the activations. The "affirmative" condition, without any additional modifiers, exhibits the highest explained variance by the first PC, implying that the primary mode of variation in the data is strongly related to affirmative statements. The addition of negation, conjunctions, disjunctions, and German language data introduces more complexity, leading to a distribution of variance across multiple principal components. This could indicate that these conditions introduce additional dimensions of variation in the neural activations. The rapid decrease in explained variance after the first few PCs across all conditions suggests that the underlying data has a relatively low intrinsic dimensionality, with most of the variance captured by the first few principal components.