## Scatter Plots: Fraction of Variance Explained by PCs
### Overview
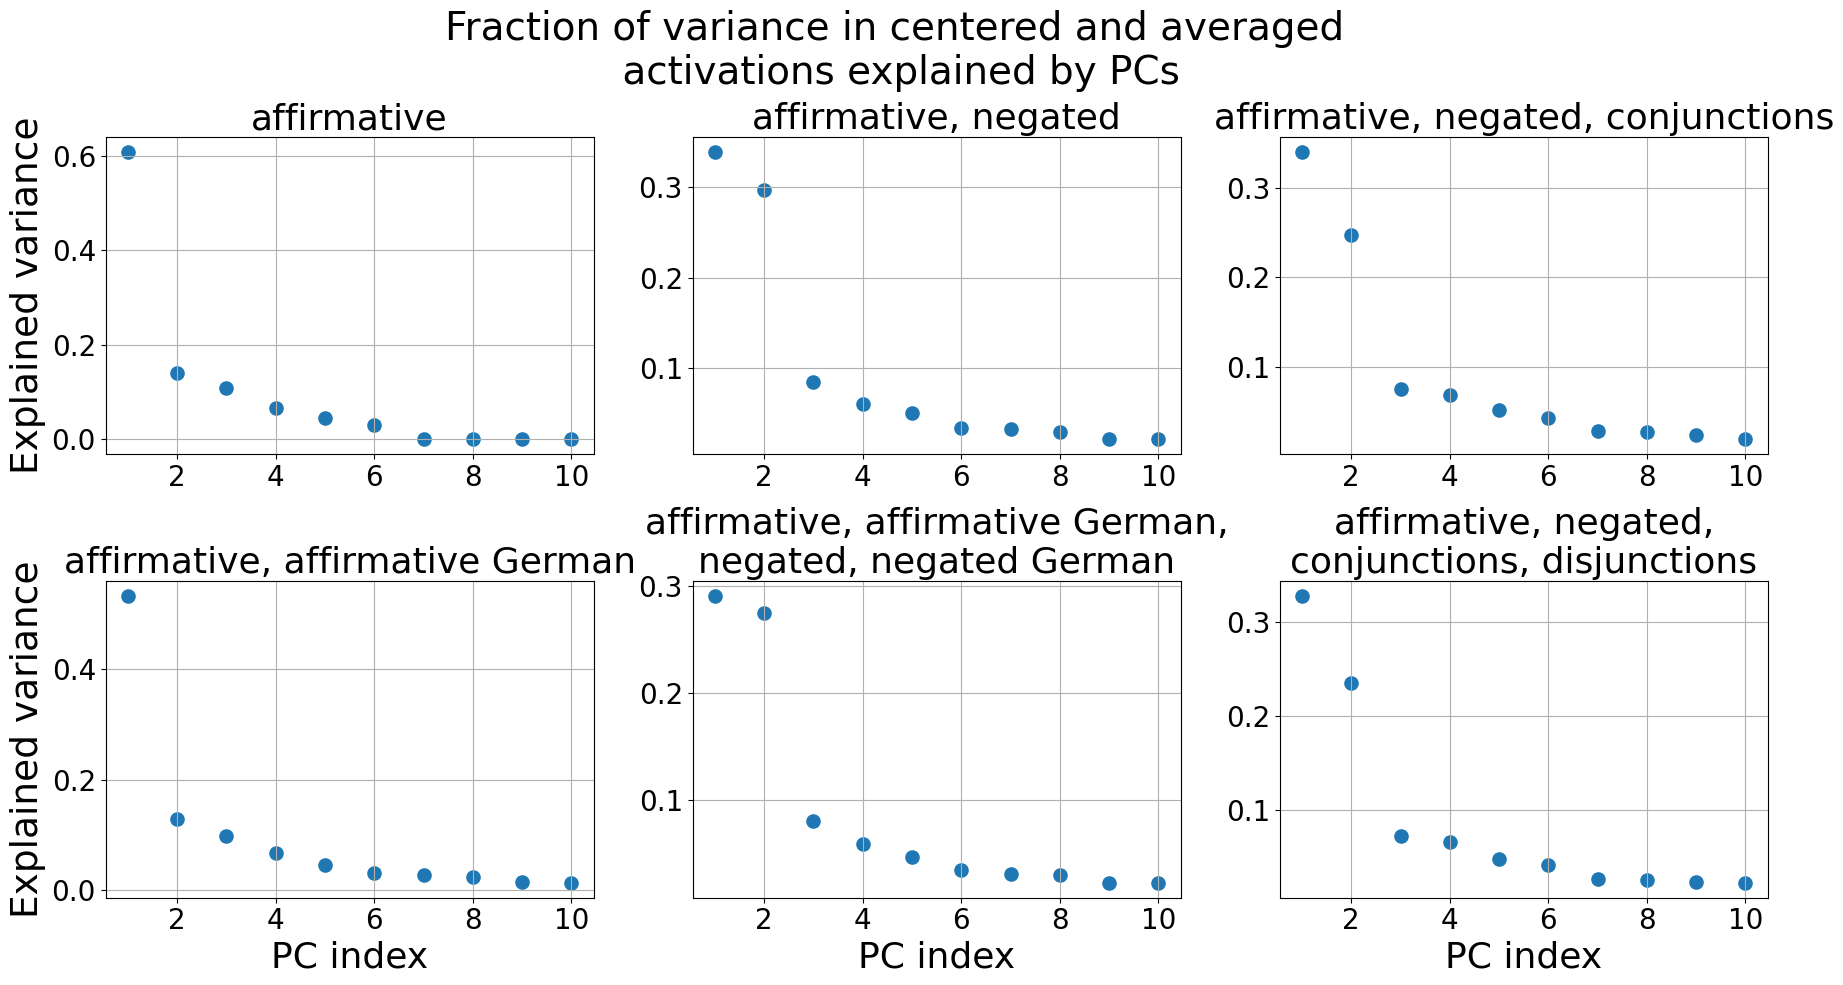
The image presents six scatter plots, each visualizing the fraction of variance in centered and averaged activations explained by Principal Components (PCs). Each plot corresponds to a different linguistic condition. The x-axis represents the PC index (ranging from 1 to 10), and the y-axis represents the explained variance (ranging from 0 to approximately 0.6).
### Components/Axes
* **Title:** "Fraction of variance in centered and averaged activations explained by PCs" (centered at the top)
* **X-axis Label:** "PC index" (present on all plots)
* **Y-axis Label:** "Explained variance" (present on all plots)
* **Plots (from top-left to bottom-right):**
1. "affirmative"
2. "affirmative, negated"
3. "affirmative, negated, conjunctions"
4. "affirmative, affirmative German"
5. "affirmative, affirmative German, negated, negated German"
6. "affirmative, negated, conjunctions, disjunctions"
* **Axis Scales:** Both axes appear to be linear. The x-axis ranges from 1 to 10. The y-axis ranges from 0 to approximately 0.6.
* **Data Points:** Each plot contains approximately 10 data points, represented as blue circles.
### Detailed Analysis or Content Details
**Plot 1: "affirmative"**
* Trend: The explained variance initially peaks at PC index 1 and then declines rapidly.
* Data Points (approximate):
* PC 1: 0.55
* PC 2: 0.08
* PC 3: 0.03
* PC 4: 0.02
* PC 5: 0.01
* PC 6: 0.01
* PC 7: 0.01
* PC 8: 0.01
* PC 9: 0.01
* PC 10: 0.01
**Plot 2: "affirmative, negated"**
* Trend: Similar to the first plot, the explained variance peaks at PC index 1 and then declines.
* Data Points (approximate):
* PC 1: 0.32
* PC 2: 0.07
* PC 3: 0.04
* PC 4: 0.03
* PC 5: 0.02
* PC 6: 0.02
* PC 7: 0.01
* PC 8: 0.01
* PC 9: 0.01
* PC 10: 0.01
**Plot 3: "affirmative, negated, conjunctions"**
* Trend: Peaks at PC index 1, then declines.
* Data Points (approximate):
* PC 1: 0.32
* PC 2: 0.06
* PC 3: 0.04
* PC 4: 0.03
* PC 5: 0.02
* PC 6: 0.02
* PC 7: 0.01
* PC 8: 0.01
* PC 9: 0.01
* PC 10: 0.01
**Plot 4: "affirmative, affirmative German"**
* Trend: Peaks at PC index 1, then declines.
* Data Points (approximate):
* PC 1: 0.42
* PC 2: 0.06
* PC 3: 0.03
* PC 4: 0.02
* PC 5: 0.01
* PC 6: 0.01
* PC 7: 0.01
* PC 8: 0.01
* PC 9: 0.01
* PC 10: 0.01
**Plot 5: "affirmative, affirmative German, negated, negated German"**
* Trend: Peaks at PC index 1, then declines.
* Data Points (approximate):
* PC 1: 0.32
* PC 2: 0.08
* PC 3: 0.04
* PC 4: 0.03
* PC 5: 0.02
* PC 6: 0.02
* PC 7: 0.01
* PC 8: 0.01
* PC 9: 0.01
* PC 10: 0.01
**Plot 6: "affirmative, negated, conjunctions, disjunctions"**
* Trend: Peaks at PC index 1, then declines.
* Data Points (approximate):
* PC 1: 0.32
* PC 2: 0.06
* PC 3: 0.04
* PC 4: 0.03
* PC 5: 0.02
* PC 6: 0.02
* PC 7: 0.01
* PC 8: 0.01
* PC 9: 0.01
* PC 10: 0.01
### Key Observations
* All plots exhibit a similar pattern: a steep decline in explained variance after the first PC.
* The "affirmative" condition shows the highest explained variance for the first PC (approximately 0.55).
* The remaining conditions have lower explained variance for the first PC, ranging from approximately 0.32 to 0.42.
* The explained variance for PCs 2 through 10 is consistently low across all conditions.
### Interpretation
The data suggests that the first Principal Component captures a significant portion of the variance in the centered and averaged activations for all linguistic conditions. This indicates that there is a dominant underlying factor influencing the data. The differences in explained variance for the first PC across conditions suggest that this dominant factor may be modulated by the specific linguistic context (affirmative, negated, conjunctions, disjunctions, and German). The rapid decline in explained variance for subsequent PCs indicates that these components contribute relatively little to explaining the overall variance in the data. The similarity in the patterns across the different conditions suggests a common underlying structure in how these linguistic elements are represented. The higher variance explained by the first PC in the "affirmative" condition might indicate a simpler or more consistent representation of affirmative statements compared to the other, more complex linguistic structures.